Gold's demand story is not a simple buying frenzy. The World Gold Council's Gold Demand Trends: Q3 2026 describes a market where central banks and ETF investors are absorbing metal while jewellery shoppers and physical retail buyers become more cautious. The total is holding near record levels, but the composition matters more than the headline.
Q3 2026 at a glance
- 321 tonnes: estimated central bank net purchases, up 42% year on year.
- 211 tonnes: gold ETF inflows, reversing Q2's 47-tonne outflow.
- 313 tonnes: jewellery consumption, down 17% year on year.
- US$4,262 an ounce: quarterly average LBMA PM gold price, up 23% year on year but down 5% from Q2.
Total demand, including over-the-counter activity and other flows, was 1,369 tonnes, down 1% from a year earlier. Across the first nine months, demand of 3,881 tonnes was virtually unchanged from 2025's record 3,884 tonnes. Its value nevertheless reached a record US$566 billion.
That is the central distinction: a record dollar value does not mean a record acceleration in physical buying. Gold's higher price is doing much of the work. Underneath the aggregate, different buyers are responding very differently.
1. Central banks are buying strategically — but much of the activity is estimated
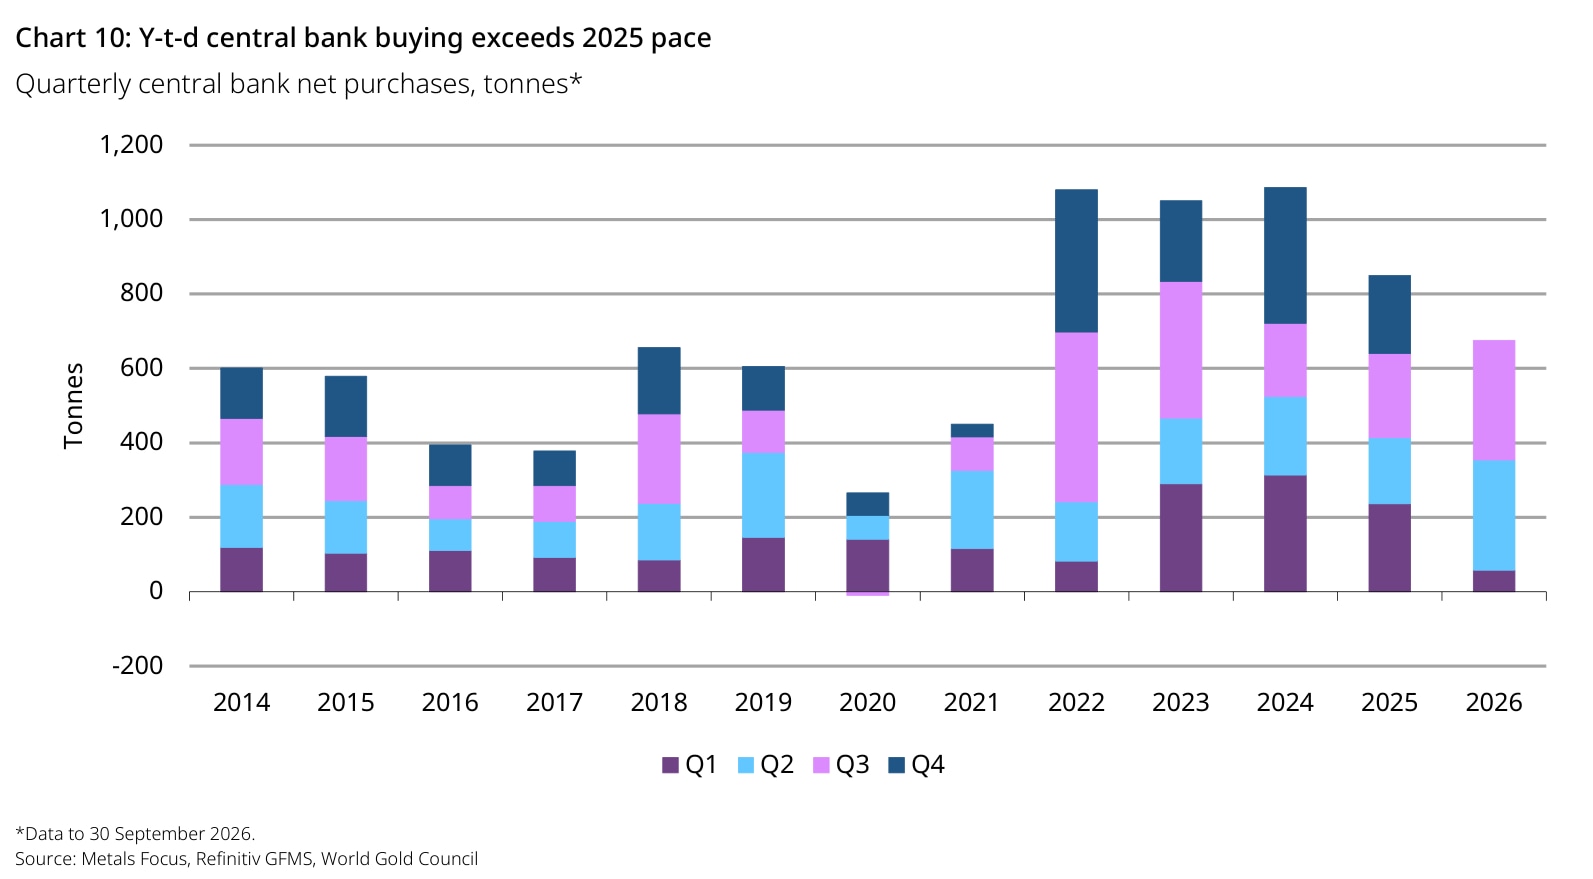
Central banks and other official institutions bought an estimated 321 tonnes in Q3, comfortably above the five-year quarterly average of 227 tonnes. First-nine-month purchases reached 675 tonnes, 6% ahead of the comparable period in 2025.
The chart shows how a quiet first quarter gave way to much stronger buying in Q2 and Q3. It also needs to be read correctly: the 2026 bar contains only three quarters, while the earlier annual bars include Q4. It is the year-to-date comparison, not the full bar heights, that supports the report's claim of a faster pace.
China added about 63 tonnes and Poland about 40 tonnes in the quarter. Kazakhstan and Uzbekistan each added roughly 14 tonnes. These disclosed purchases support the Council's interpretation that reserve diversification and risk management remain important even at historically elevated prices.
The qualification is substantial: reported net buying was only about 120 tonnes, versus estimated total demand of 321 tonnes. Around 63% of the headline figure was unreported activity estimated by the report's data providers. Disclosed country figures therefore cannot tell us who bought all of that metal, and the total is subject to revision.
For investors, this is evidence of persistent official-sector demand, not proof of a guaranteed price floor. Central banks are not one coordinated buyer, and their future purchases can change.
2. ETF investors returned — even as gold's average price fell
Physically backed gold ETFs added 211 tonnes during Q3, more than reversing the 47-tonne outflow in Q2. Global holdings reached a record 4,256 tonnes, while the Council reported a record US$31 billion in quarterly inflows.
European-listed funds led the increase with 92 tonnes, including 53 tonnes in UK-listed products. The report links the renewed interest to concerns about inflation, fiscal sustainability and sovereign bond markets, among other factors.
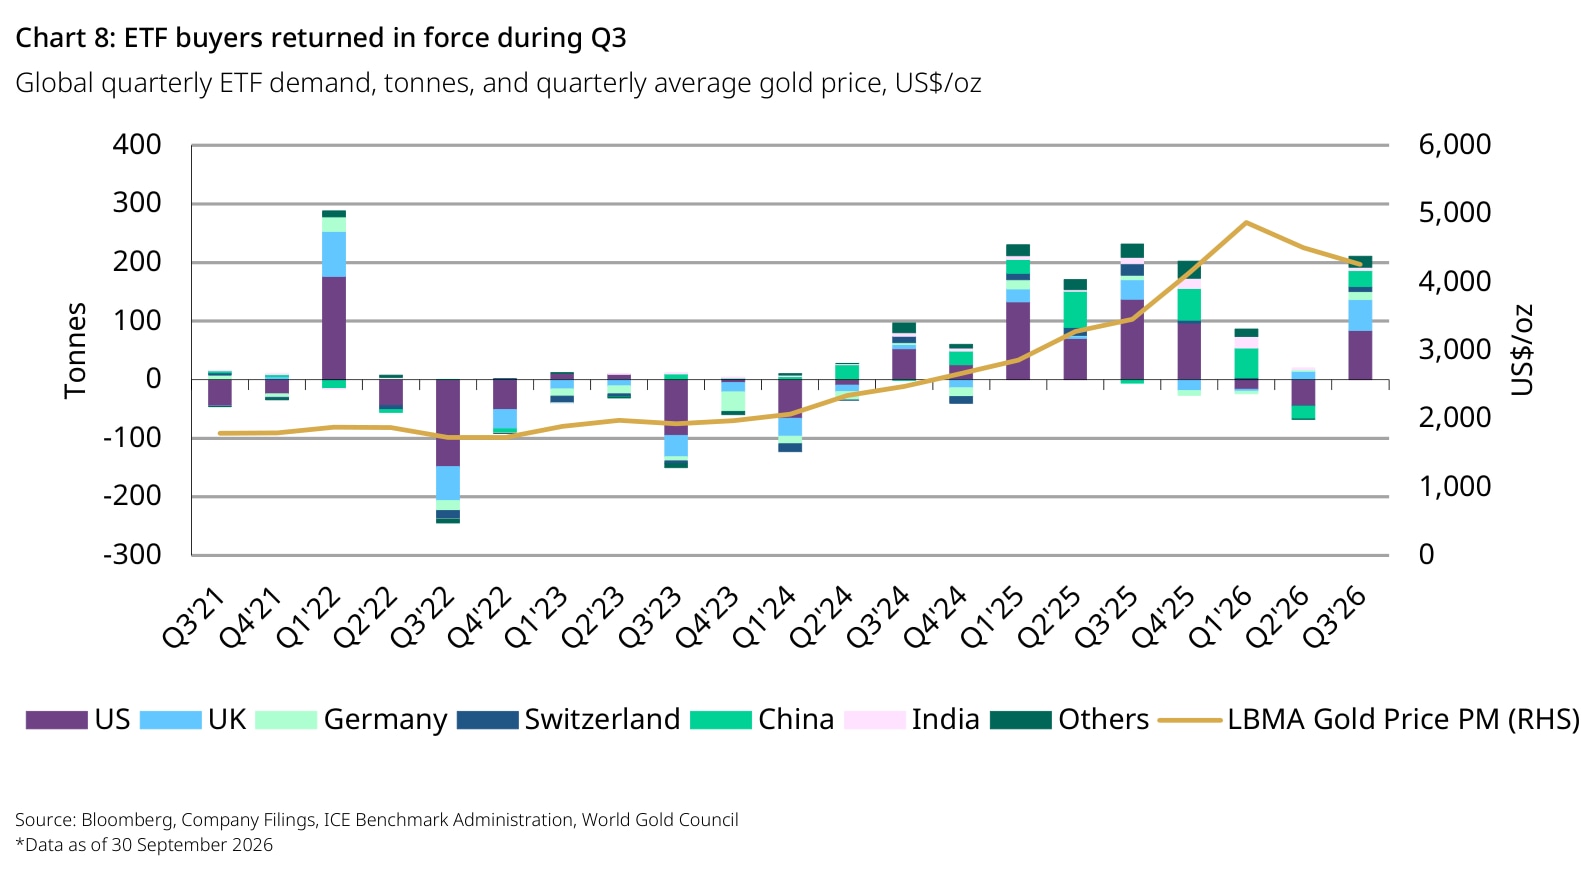
The interesting feature is the divergence between flows and price. ETF buying recovered sharply even though the quarterly average gold price fell from US$4,506 in Q2 to US$4,262 in Q3. Investors were adding exposure without a rising quarterly average price.
But the rebound was sequential, not a new high in every measure. ETF tonnage was still 6% below Q3 2025. Total investment demand excluding OTC activity was 479 tonnes, down 14% year on year, because bar-and-coin buying weakened.
ETF demand is also reversible. A quarter of inflows is supportive, but these holdings can become a source of selling if investors change their view on interest rates, currencies or portfolio risk.
3. Jewellery buyers are spending more for less gold
Jewellery offers the clearest picture of the affordability squeeze. Global consumption fell 17% to 313 tonnes, the weakest third quarter in the Council's series dating back to 2000. Yet spending rose 2% to US$43 billion.
The first-nine-month figures make the split even clearer: jewellery volumes fell 19% to 889 tonnes, while their value increased 15% to US$130 billion. Consumers have not necessarily abandoned gold jewellery, but their budgets are buying less metal.
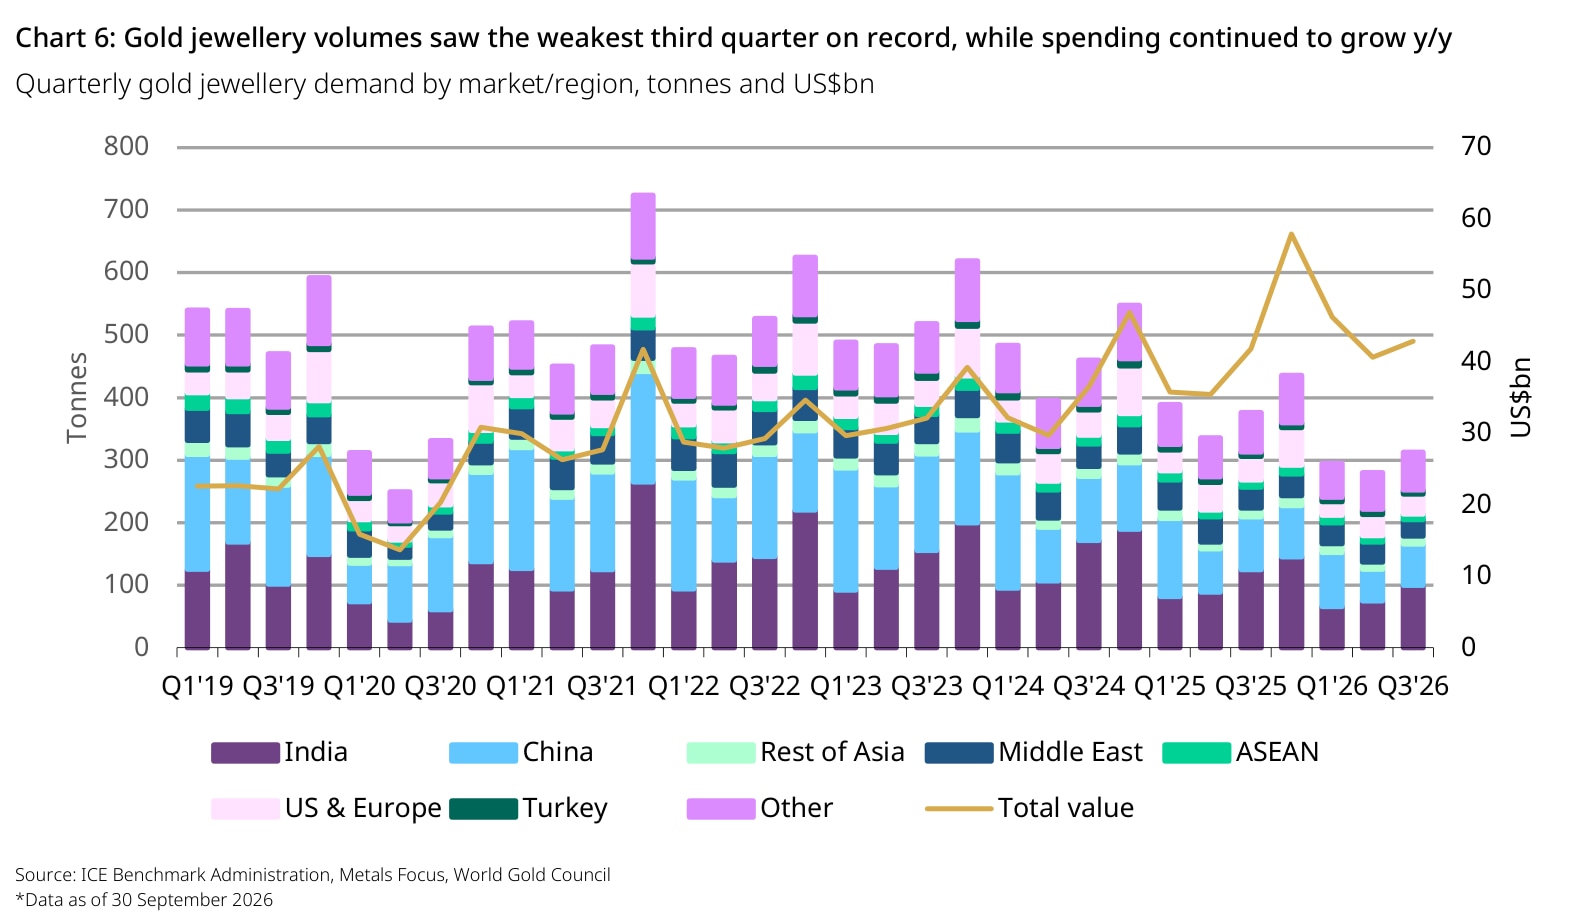
India's Q3 jewellery consumption fell 20% to about 100 tonnes, while mainland China's fell 22% to about 66 tonnes. The report describes consumers favouring lighter pieces, lower-carat products and smaller purchases.
Physical investment was softer too. Global bar-and-coin demand fell 19% to 268 tonnes. India's fell 40% to 55 tonnes, while US demand also fell 40%, to about 8 tonnes. China was an important exception: its quarterly bar-and-coin buying rose 7% year on year to about 79 tonnes.
This is why “everyone is buying gold” is the wrong conclusion. Official institutions, fund investors and retail consumers have different motives, budgets and time horizons.
4. Record mine output did not translate into more total supply
Mine production rose 3% year on year to 1,071 tonnes, a record for a third quarter. Year-to-date mine output was up 2%, leaving full-year production on course for a record, provided Q4 did not bring widespread disappointments.
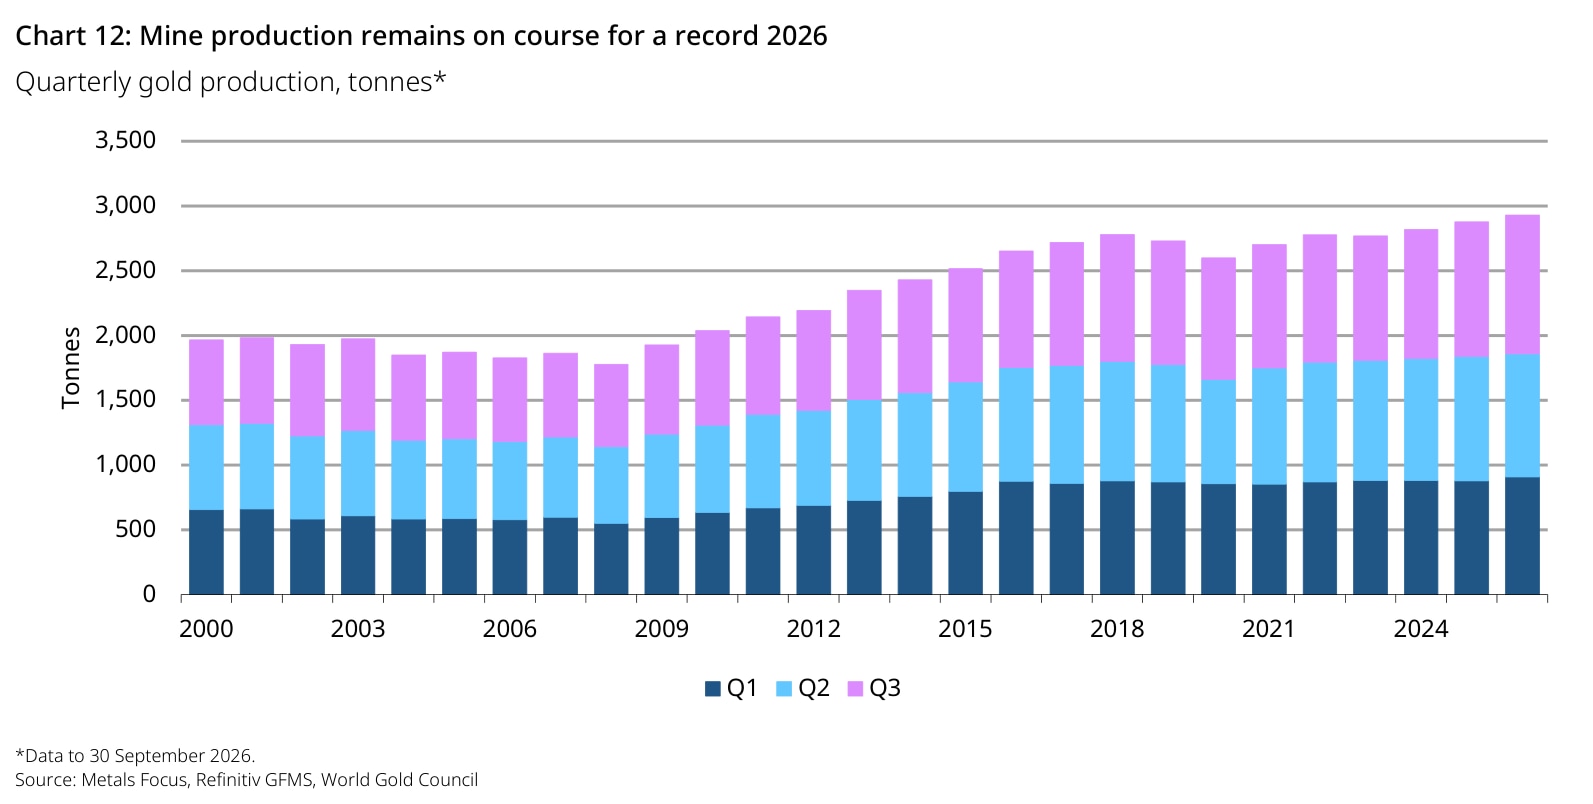
Despite that increase, total supply fell 1% to 1,369 tonnes. Recycling declined 8% to roughly 314 tonnes, its lowest quarterly level since Q4 2023, while net producer de-hedging reduced measured supply by about 17 tonnes.
The result challenges the assumption that a historically high gold price automatically brings a wave of scrap metal to market. The Council sees only modest supply growth ahead, with mine production the most likely contributor. That is its outlook, not a certainty.
What matters next
Our reading is that gold's resilience increasingly depends on investment and reserve-allocation decisions offsetting pressure on price-sensitive physical consumption. That mix can support the market, but it also leaves gold exposed to shifts in investor sentiment.
- ETF persistence: does Q3's return to inflows continue, or do higher-for-longer interest rates and competing assets pull capital away?
- Official-sector follow-through: do central banks sustain their buying, and how much of the estimated activity is subsequently disclosed or revised?
- Consumer affordability: can jewellery volumes stabilise without a meaningful price decline?
- Supply response: does recycling stay subdued, and can miners deliver the production growth assumed in the outlook?
For gold-equity investors, the bullion backdrop is only a starting point. Costs, grades, recovery rates, capital requirements, currencies and hedging determine how much of a high gold price reaches shareholders. Strong demand for the metal is not, by itself, an investment case for every miner or explorer.
The takeaway: the Q3 report is less a story of demand accelerating everywhere than of buyers taking different paths. Central banks are adding reserves, ETF investors have returned, and jewellery buyers are adapting to the price. Watching that balance is more useful than treating the record dollar value as a universal bullish signal.
Source and methodology: World Gold Council, Gold Demand Trends: Q3 2026, published November 2026, supplied report. Figures above are drawn from pp.1–2, 6, 10–11, 15–16 and 19. Quarterly market data are to 30 September 2026; reported central bank information was captured to 30 October 2026. Values are in US dollars unless stated otherwise. Figures are rounded and may be revised. The central-bank section uses the latest Q2 estimate in this report, not the earlier estimate cited in our previous coverage. OTC and other flows include less-visible investment activity and a statistical residual; they are not all directly observed purchases.
Charts are limited extracts from the supplied report, reproduced for review and commentary. © 2026 World Gold Council and the respective data providers identified in each caption. Cashu Research's interpretation is independent; no World Gold Council endorsement is implied. World Gold Council research.
Related reading: Our earlier look at central bank buying and gold fund flows. That article reflects an earlier data snapshot, not the latest Q3 estimates.
General information only. This article is commentary on the supplied report, not a personal recommendation or a gold-price forecast. It does not take account of your objectives, financial situation or needs. Gold, ETFs and mining shares can fall in value; past performance is not a reliable indicator of future results. Seek independent professional advice where appropriate.