
Gold peaked at US$5,589 per ounce in January. Today it sits at US$4,047 — 28% below that peak (on a calendar year-to-date basis the fall is a milder 6.4%, as gold entered 2026 well below the January high). You'd expect panicked selling across the board. Instead, something interesting is happening: the world's central banks are buying more gold than ever, while North American ETF investors are dumping it — even as global ETF demand has stayed slightly positive on Asian and European inflows. These two forces are now wrestling for control of the market.
The Central Bank Bid Is Getting Stronger
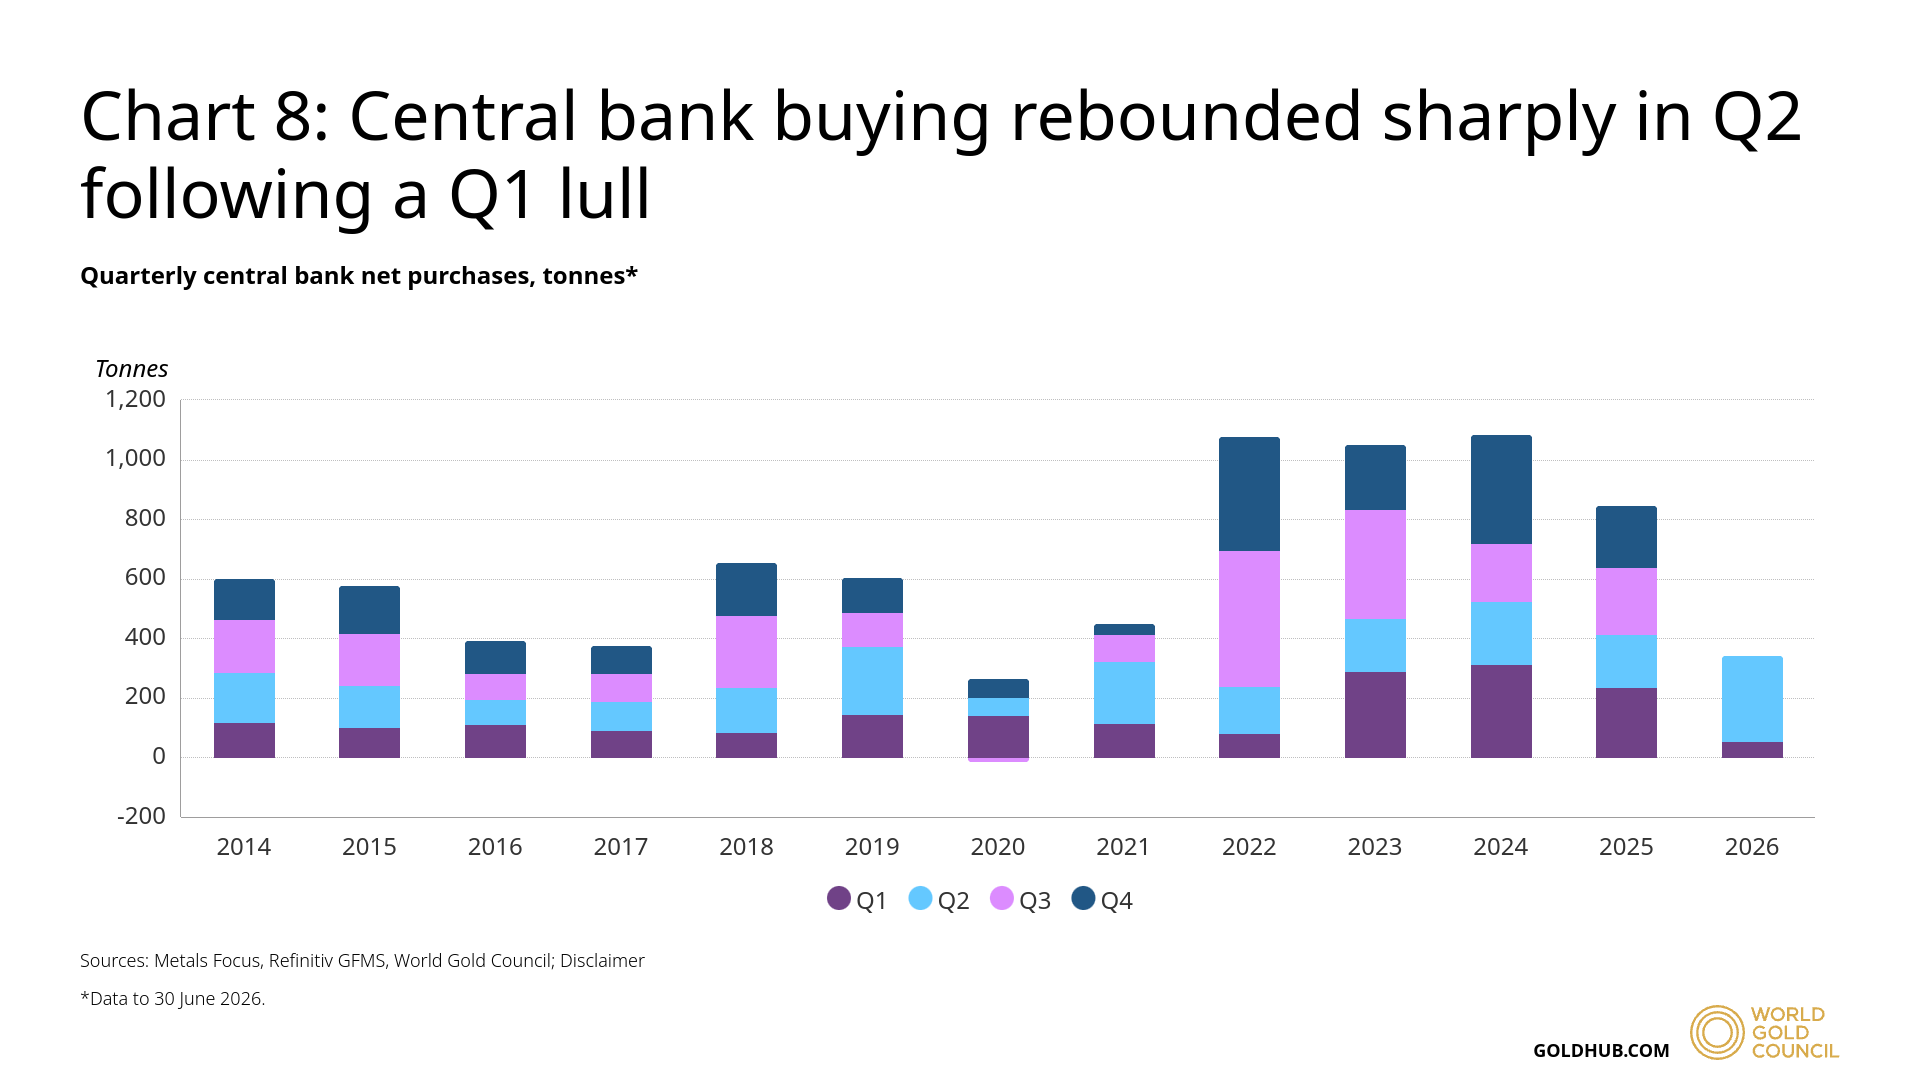
In the second quarter of 2026, central banks bought 289 tonnes of gold. That's a record for any Q2 on the World Gold Council's historical data — and they bought it while prices were falling 14% that same quarter.
Here's who's buying and why it matters:
Poland's National Bank added 51 tonnes in Q2. They're on a mission to hold 700 tonnes of gold by year-end, and they've been adding consistently for over 20 months. This isn't a quick trade; it's a deliberate policy.
China's central bank purchased 33 tonnes in Q2, their biggest haul since late 2023. China now holds 2,346 tonnes — about 9% of their total reserves. That's a significant shift. When a central bank this large starts concentrating in gold, it signals something about how they see the future of global currency.
Uzbekistan and Kazakhstan are treating gold almost like a savings account. For them, 87% and 78% of their official reserves sit in bullion. They're not trying to time the market; they're building security.
Central bank buying rebounded sharply in Q2 following a Q1 lull
Quarterly central bank net purchases in tonnes, 2014 to 2026, split by quarter.
Add smaller buyers — the Czech National Bank, Jordan, Singapore — and you have a pattern: central banks are not selling on weakness. They're doing the opposite.
Key Takeaway
The World Gold Council's 289-tonne figure is an estimate that already includes unreported purchases — only about half of Q2's buying came from announced sources, with the rest attributed to central banks that don't publicize their moves. So undisclosed accumulation is captured in the headline number, not sitting on top of it.
What This Means for Central Banks Long-Term
These institutions operate on 10, 20, even 40-year timelines. A 28% drawdown in gold prices is not scary to them — it's an opportunity. And the numbers back this up.
In a recent survey, 89% of central banks said they expect global official gold reserves to grow over the next year, and 45% expect to increase their own holdings. Only 1% said they plan to reduce. That's remarkable consensus for a commodity trading 28% below its recent peak.
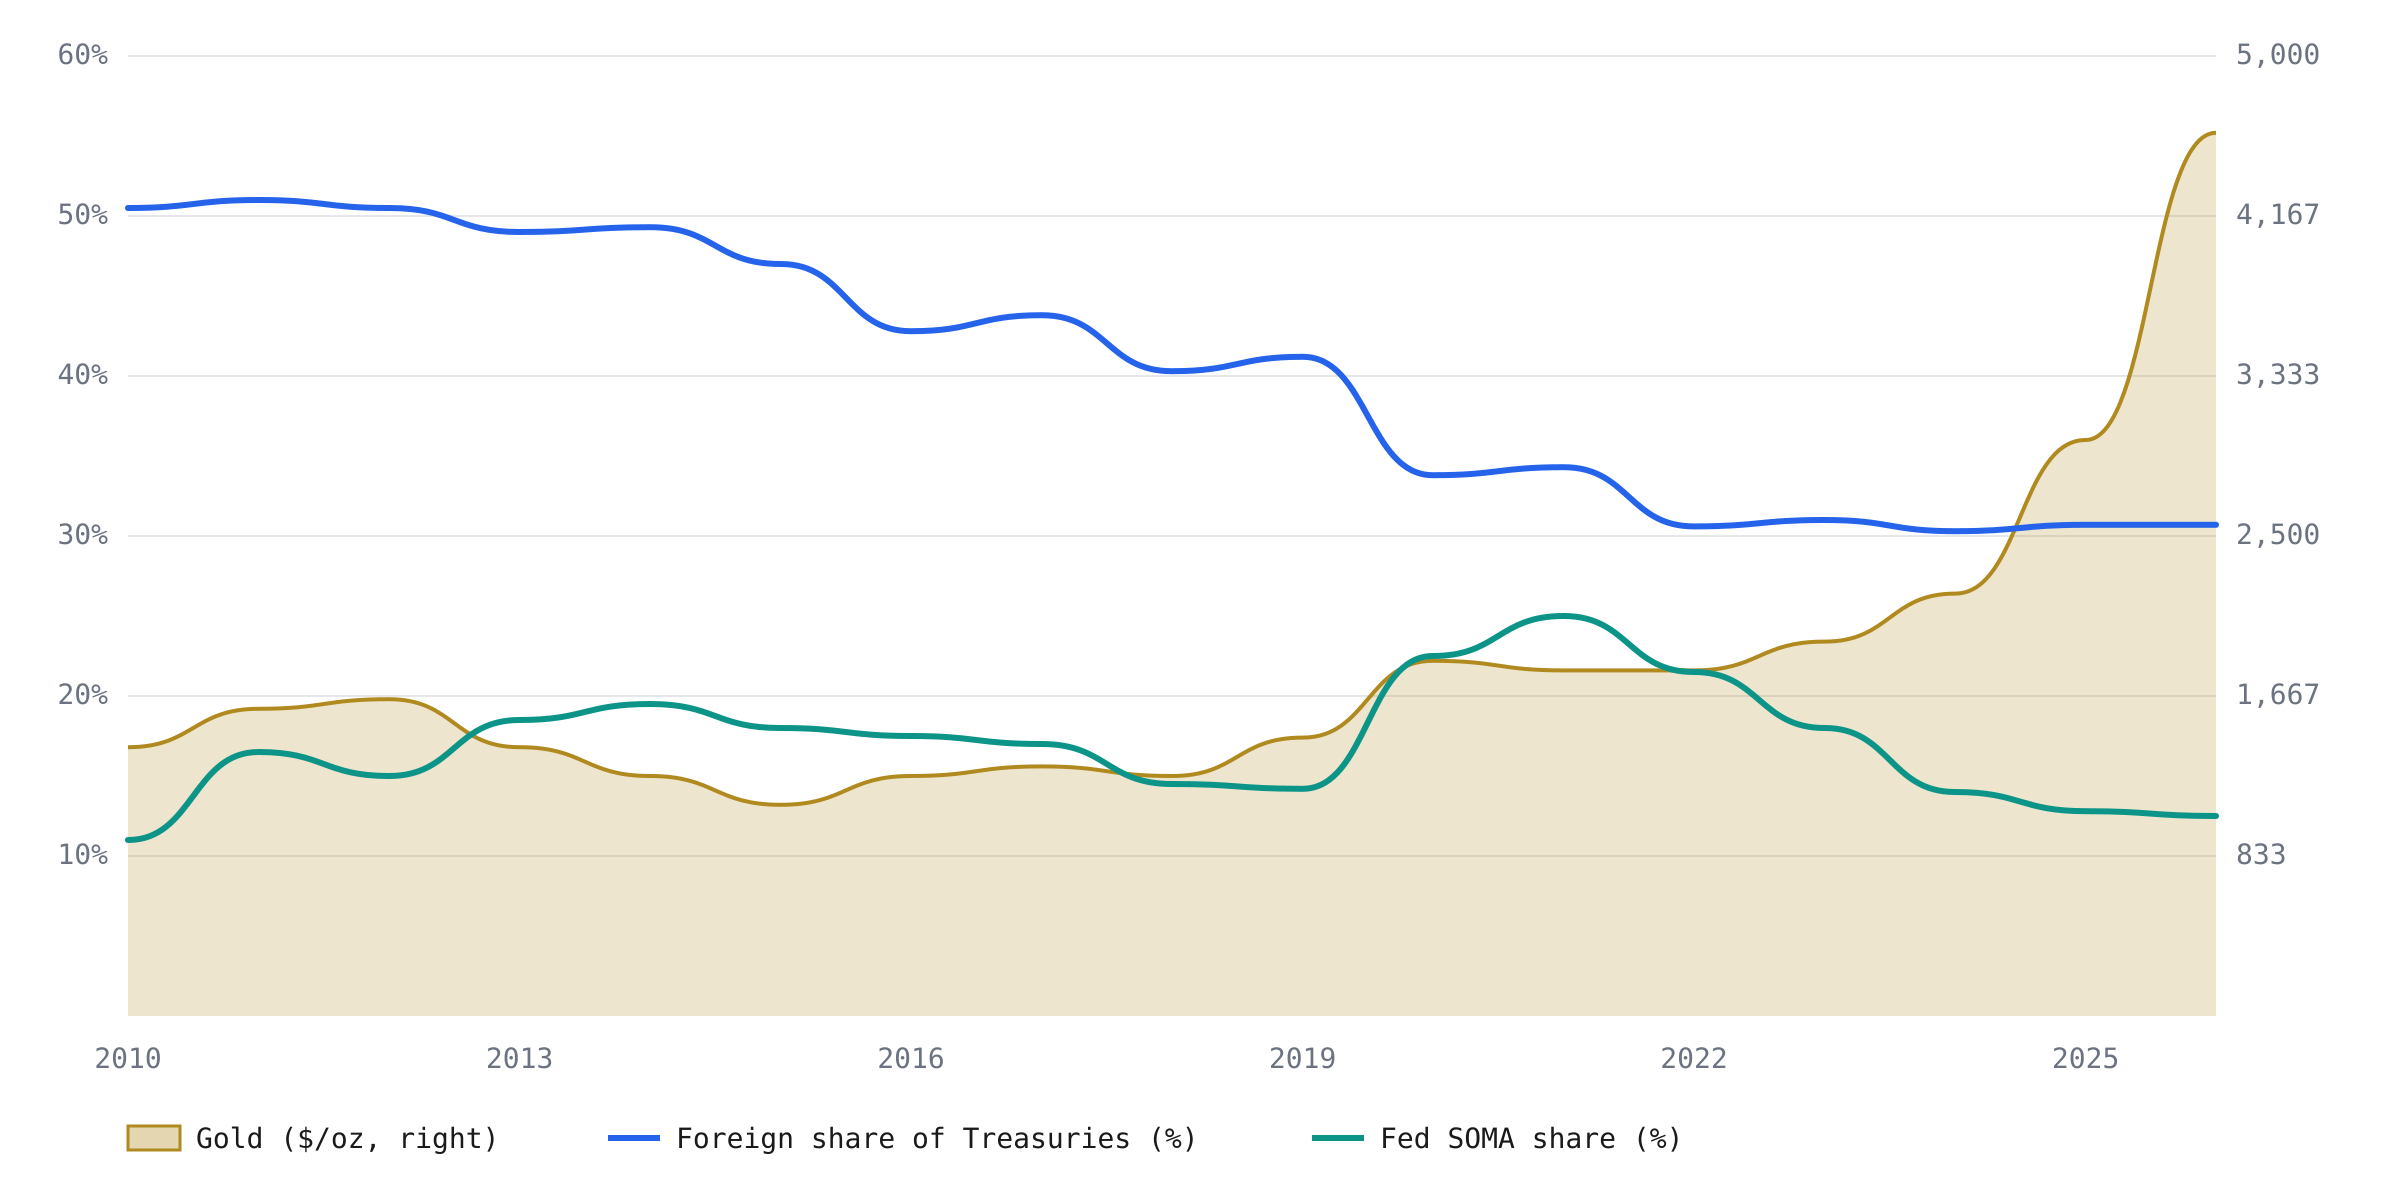
Meanwhile, the ECB made an interesting observation: gold now represents 27% of global official reserves. That's the first time gold has surpassed US Treasury holdings (22%) in official reserve composition. Gold has quietly become the largest reserve asset, beating the US dollar's traditional dominance.
From Treasuries to gold: the reserve asset shift
Foreign share of US Treasuries and Fed SOMA share (%, left axis) against the gold price (US$/oz, right axis), 2010 to mid-2026.
Non-State Institutional Accumulation: Tether
While central banks dominate official-sector accumulation, a non-traditional institutional buyer has emerged as a material market participant. Tether, the USDT stablecoin issuer, disclosed holdings of 146+ tonnes of physical gold as of 30 June 2026, valued at approximately US$18.8 billion. The gold sits within USDT's reserve backing — roughly 10% of Tether's US$188 billion in reserves — and ranks the company among the world's top 30 gold holders, larger than the official reserves of Australia, South Korea, the UAE, or Qatar.
| Quarter | Estimated purchases | Approx. total holdings |
|---|---|---|
| Q3 2025 | 26 tonnes | 116 tonnes |
| Q4 2025 | 27 tonnes | 126 tonnes* |
| Q1 2026 | 6 tonnes | 132 tonnes |
| Q2 2026 | 14 tonnes | 146 tonnes |
The company purchased approximately 14 tonnes in Q2 2026 and stepped up buying frequency to 1–2 tonnes per week during the July price decline. In Q2, Tether's 14-tonne purchase represented approximately 5% of official-sector gold demand.
While this remains modest relative to central bank flows — and well short of the largest ETFs (SPDR Gold Shares alone holds roughly 999 tonnes) — Tether's status as the largest known corporate gold holder outside ETFs and central banks signals growing institutional interest in physical gold outside traditional banking and governmental structures. No comparable peer activity is evident — other stablecoin issuers such as Circle maintain Treasury and cash reserves but do not hold gold — making Tether's accumulation a discrete phenomenon rather than a sector-wide trend.
The North American Liquidation
Now flip to the other side of the market: investment funds, ETFs, and asset managers in North America.
North American gold ETFs lost 61 tonnes in the first half of 2026, even as global ETF holdings eked out a 17.6-tonne gain — Asian and European buying largely offset the Western selling. The liquidation is a distinctly North American story, and the real story is in the money flows, not the tonnes.
Gold ETF flows by region
Monthly flows in tonnes, June 2024 to June 2026, against the gold price (US$/oz)
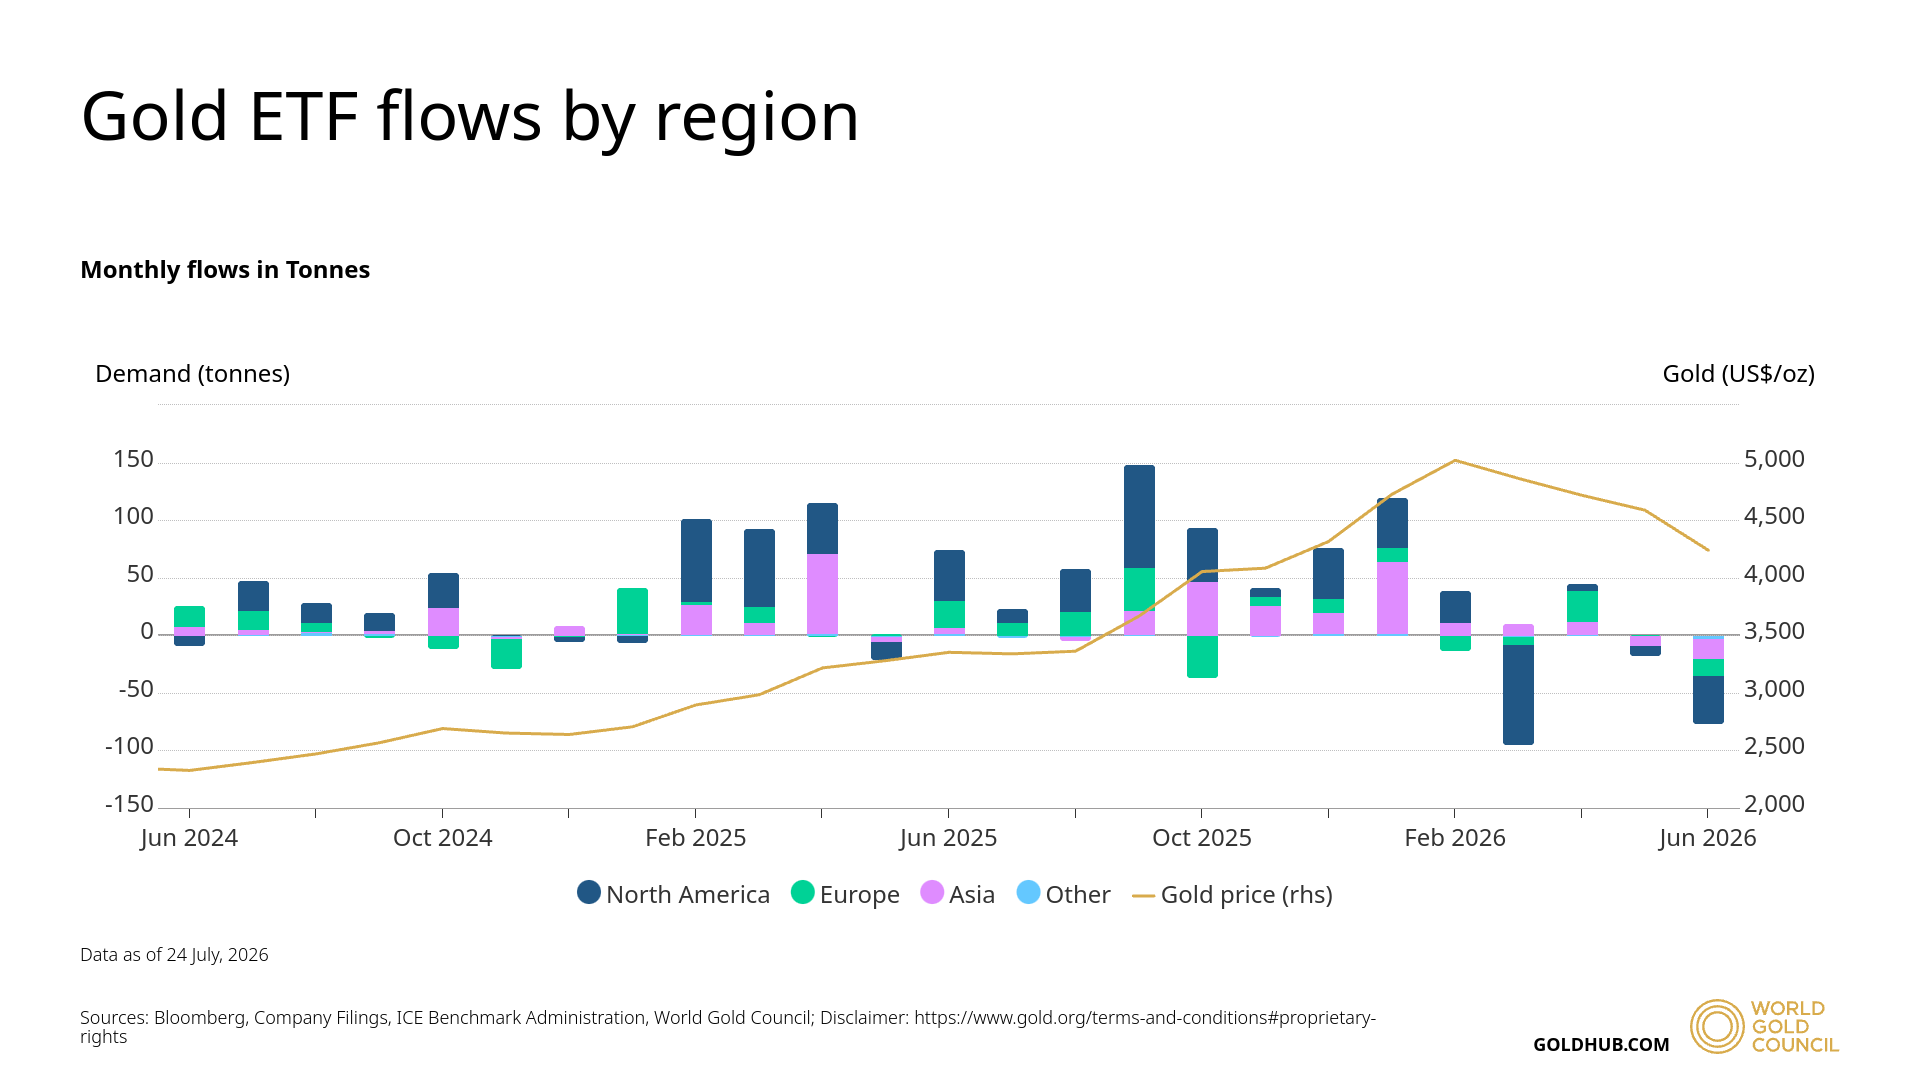
State Street, which manages much of the world's gold ETF infrastructure, disclosed that North American funds pulled out US$18.7 billion in just four months (April through July). That's after they had poured in US$11.5 billion in January and February.
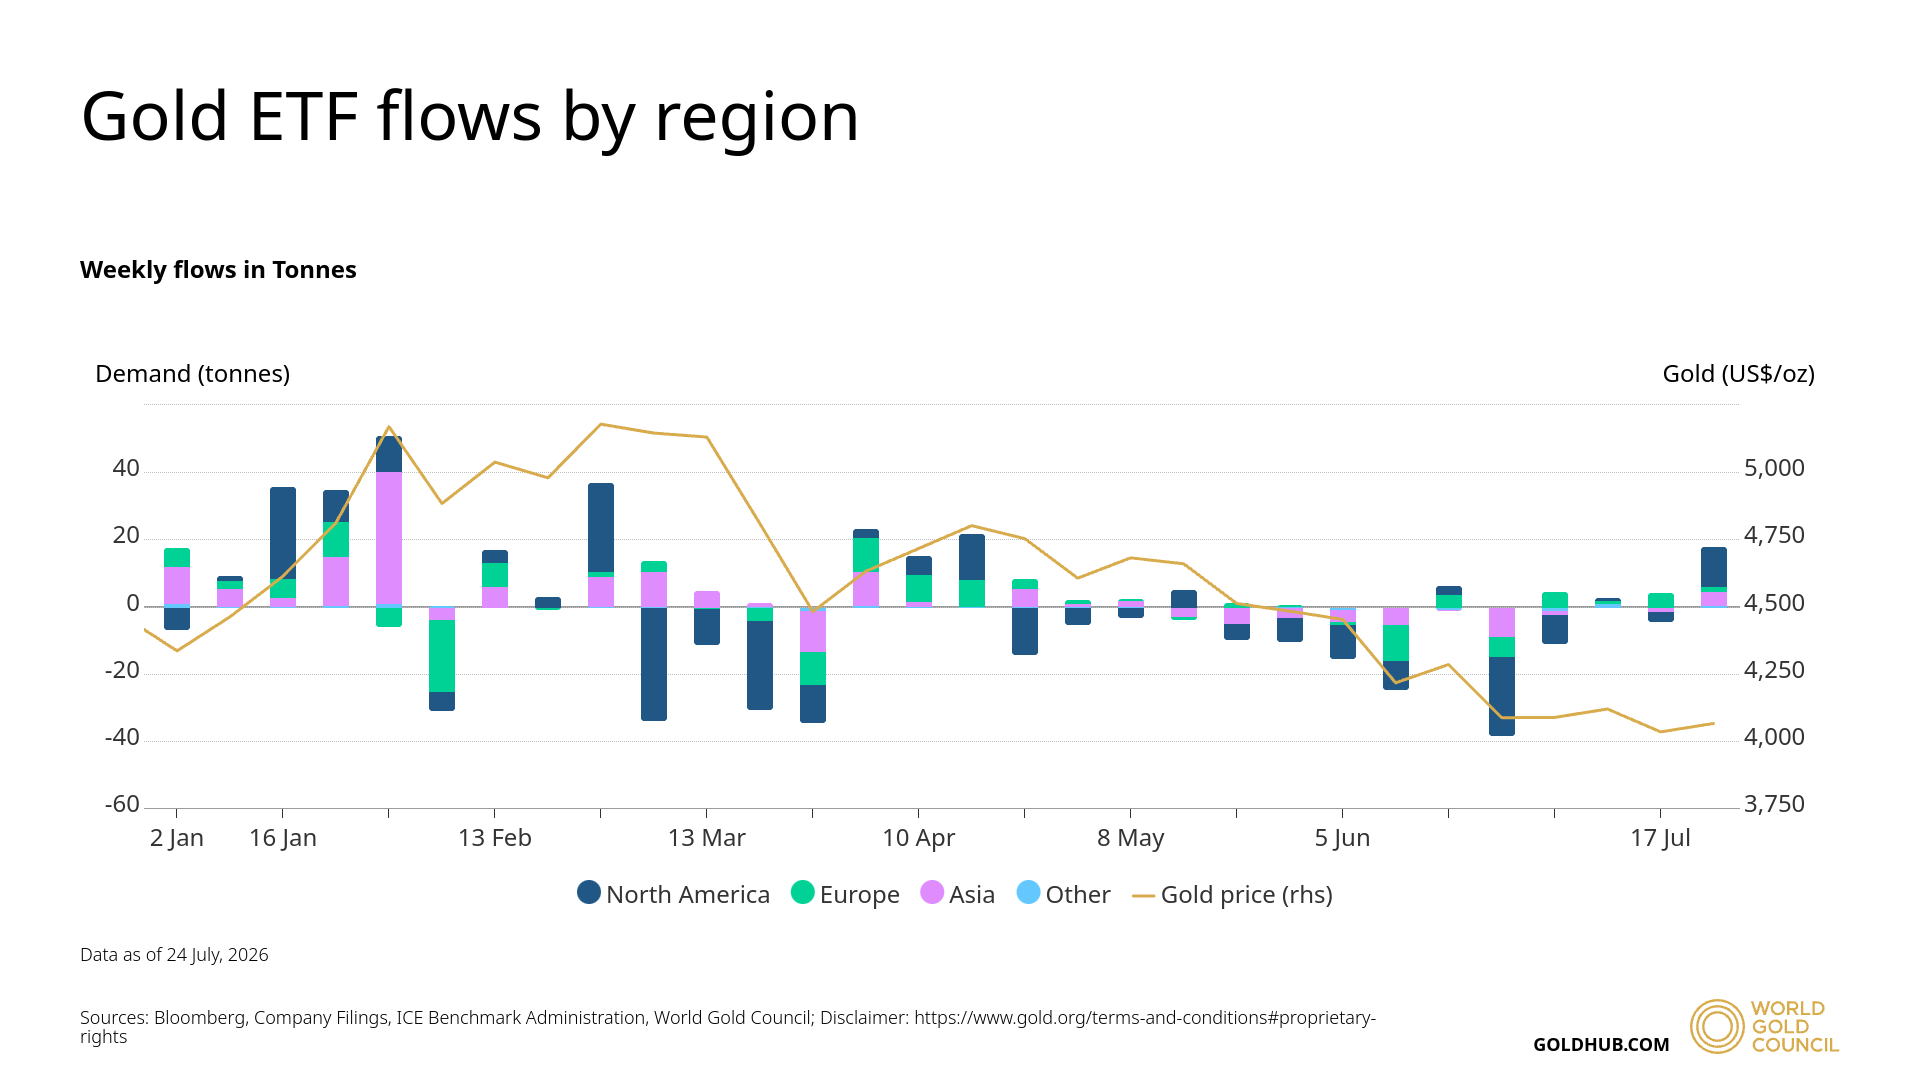
Gold ETF flows by region — 2026 week by week
Weekly flows in tonnes, January to July 2026. North American selling dominates from April onward.
Why the reversal? Simple: interest rates.
In early 2026, markets expected the Federal Reserve to cut interest rates multiple times. Lower rates are bad for holding cash and good for holding gold — no yield, but a potential hedge. By mid-February (when Kevin Warsh's nomination as Fed chair leaked), that story reversed. Suddenly markets started pricing in higher rates, not lower ones. By late July, the consensus was only 1.5 rate increases remaining in 2026.
For fund managers, that math is brutal. Gold's appeal slides when real interest rates (the rate you earn minus inflation) are rising. So they sold. It was rational, but it was also tactical — a bet on where rates were heading, not a fundamental view on gold's value.
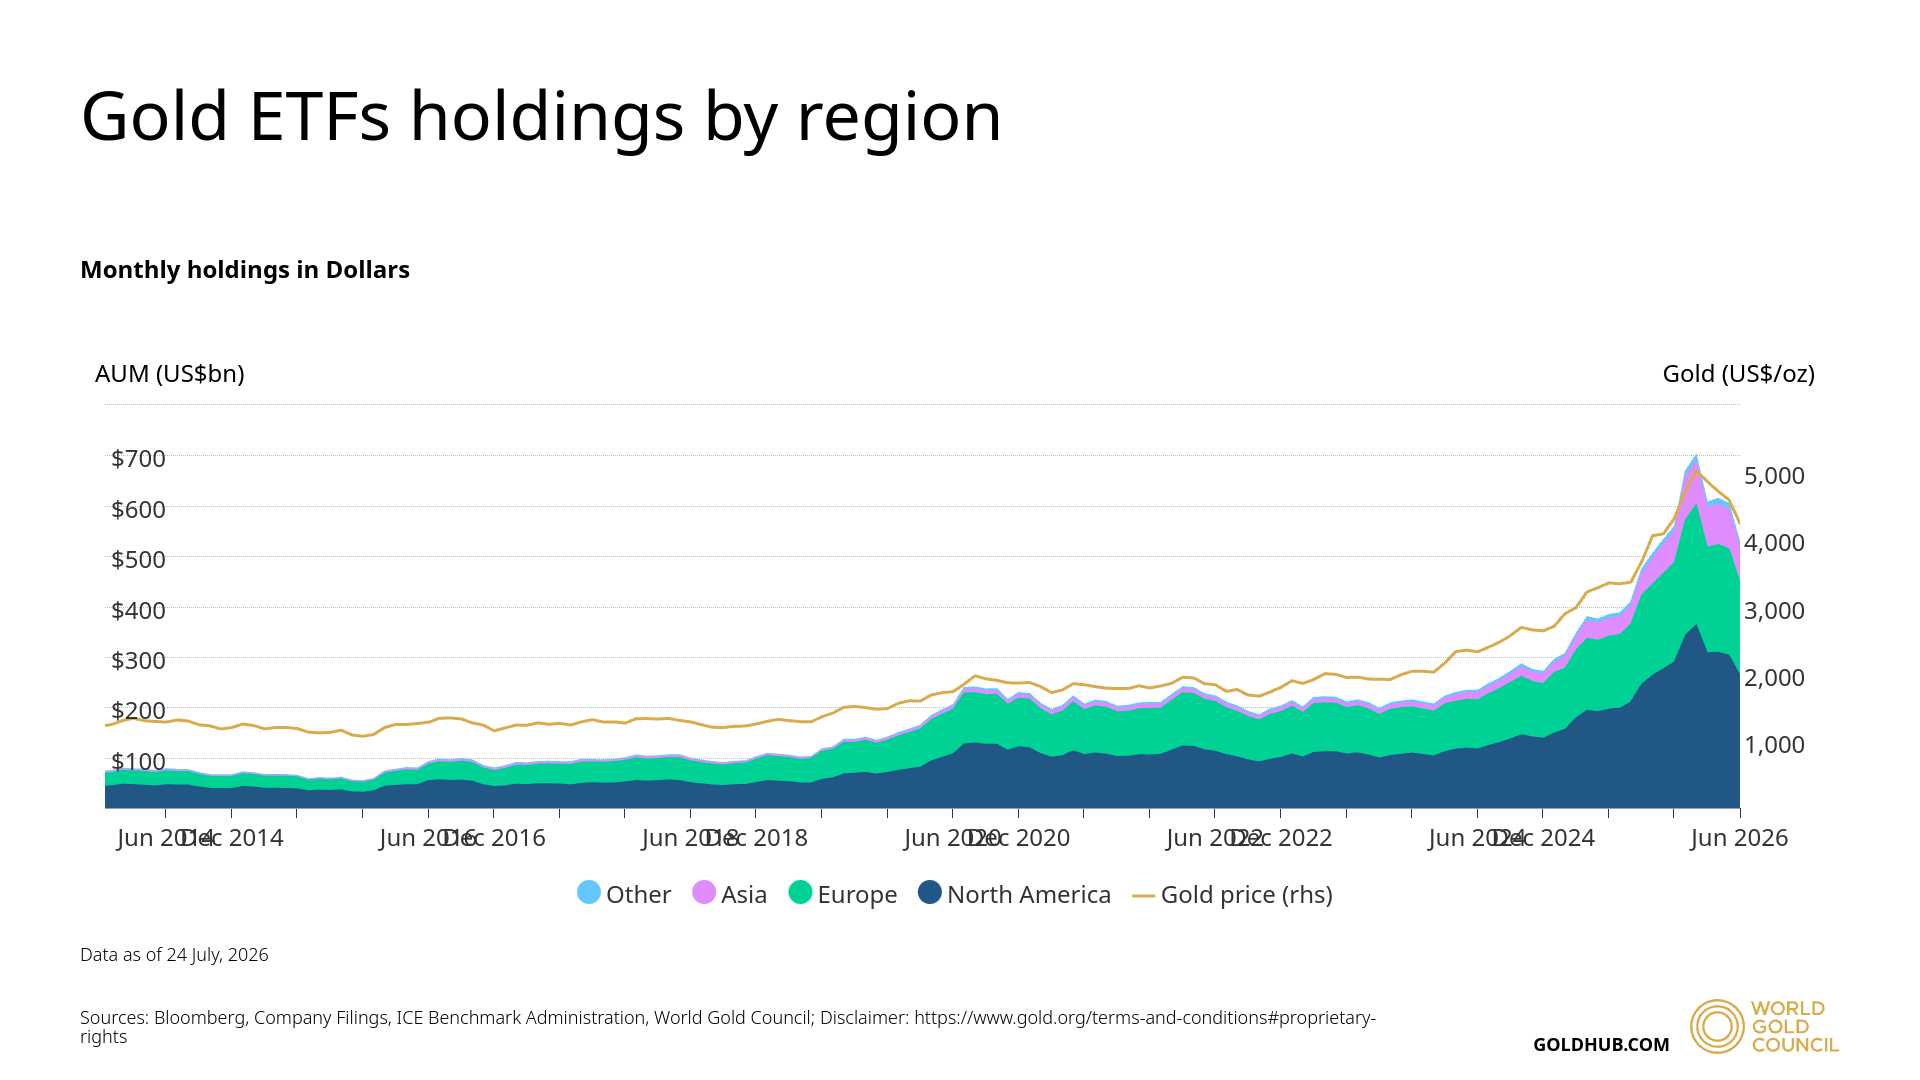
Gold ETF holdings by region
Monthly holdings in dollars (AUM, US$bn), 2014 to 2026. Even after the 2026 outflows, holdings remain near record levels.
The Two Markets
What we're seeing is a structural mismatch between two types of buyers:
Central banks say: "We need gold. It's part of our reserves for the next 30 years. Price doesn't matter much to our decision-making."
North American tactical funds say: "We own gold for the 6-month outlook. The Fed just signalled it's done cutting, so gold's real-rate support evaporates. Sell."
These are opposite instincts, and they're creating an unusual setup. In the first half of 2026, central-bank demand more than offset the North American ETF outflows — and global ETF demand actually remained slightly positive, because inflows from Asia and Europe absorbed most of the North American selling. The selling pressure is concentrated in one investor class in one region, while the structural buyers keep accumulating. That's a tug-of-war one side can sustain far longer than the other.
Where Prices Go From Here
Gold is trading between US$4,000 and US$4,100 as of late July. Technical support sits around US$3,950–4,000; resistance is around US$4,250.
State Street's base-case forecast: US$4,750 to US$5,500 over the next 6–9 months, with a midpoint near US$5,000 by early 2027.
This assumes that:
- Central banks keep buying (which we believe they will).
- North American fund selling exhausts itself (we think this is largely complete).
- The Fed either pauses rate hikes or eventually starts cutting (which would help gold).
The downside scenario (25% probability) is gold stays stuck between US$4,000 and US$4,750, grinding sideways. The tail risk (5%) is a surprise move to US$5,500+.
Structural vs. Tactical Dynamics
Gold prices fell 28% from January to July, driven largely by North American institutional traders rotating away from duration bets. Concurrently, central banks accumulated a record 289 tonnes in Q2 — a notable divergence between short-term tactical positioning and long-term structural accumulation.
Central bank surveys show 89% expect to increase reserves over the next 12 months. This multi-year reserve-building programme operates independently of spot-price momentum, reflecting decade-long planning horizons rather than quarterly performance targets. The difference in time horizons between tactical traders (operating on 6-month views) and reserve managers (operating on 10+ year mandates) is creating an unusual market structure worth monitoring.
Market Angles & Company Analysis
Important
This analysis is provided for informational purposes only and does not constitute financial advice, a recommendation to buy or sell any security, or an offer to deal in any security. All investors should conduct their own due diligence and consult a licensed financial adviser before making investment decisions. Past performance is not a guarantee of future results.
ASX Gold Miners to Watch
The ASX gold sector is down over 33% in the past six months (VanEck Gold Miners ETF, GDX), even though the companies reporting cash flows and margins are the best in years. The big caps fell an average 3.6% over two days in late July alone. That's a gap worth exploiting.
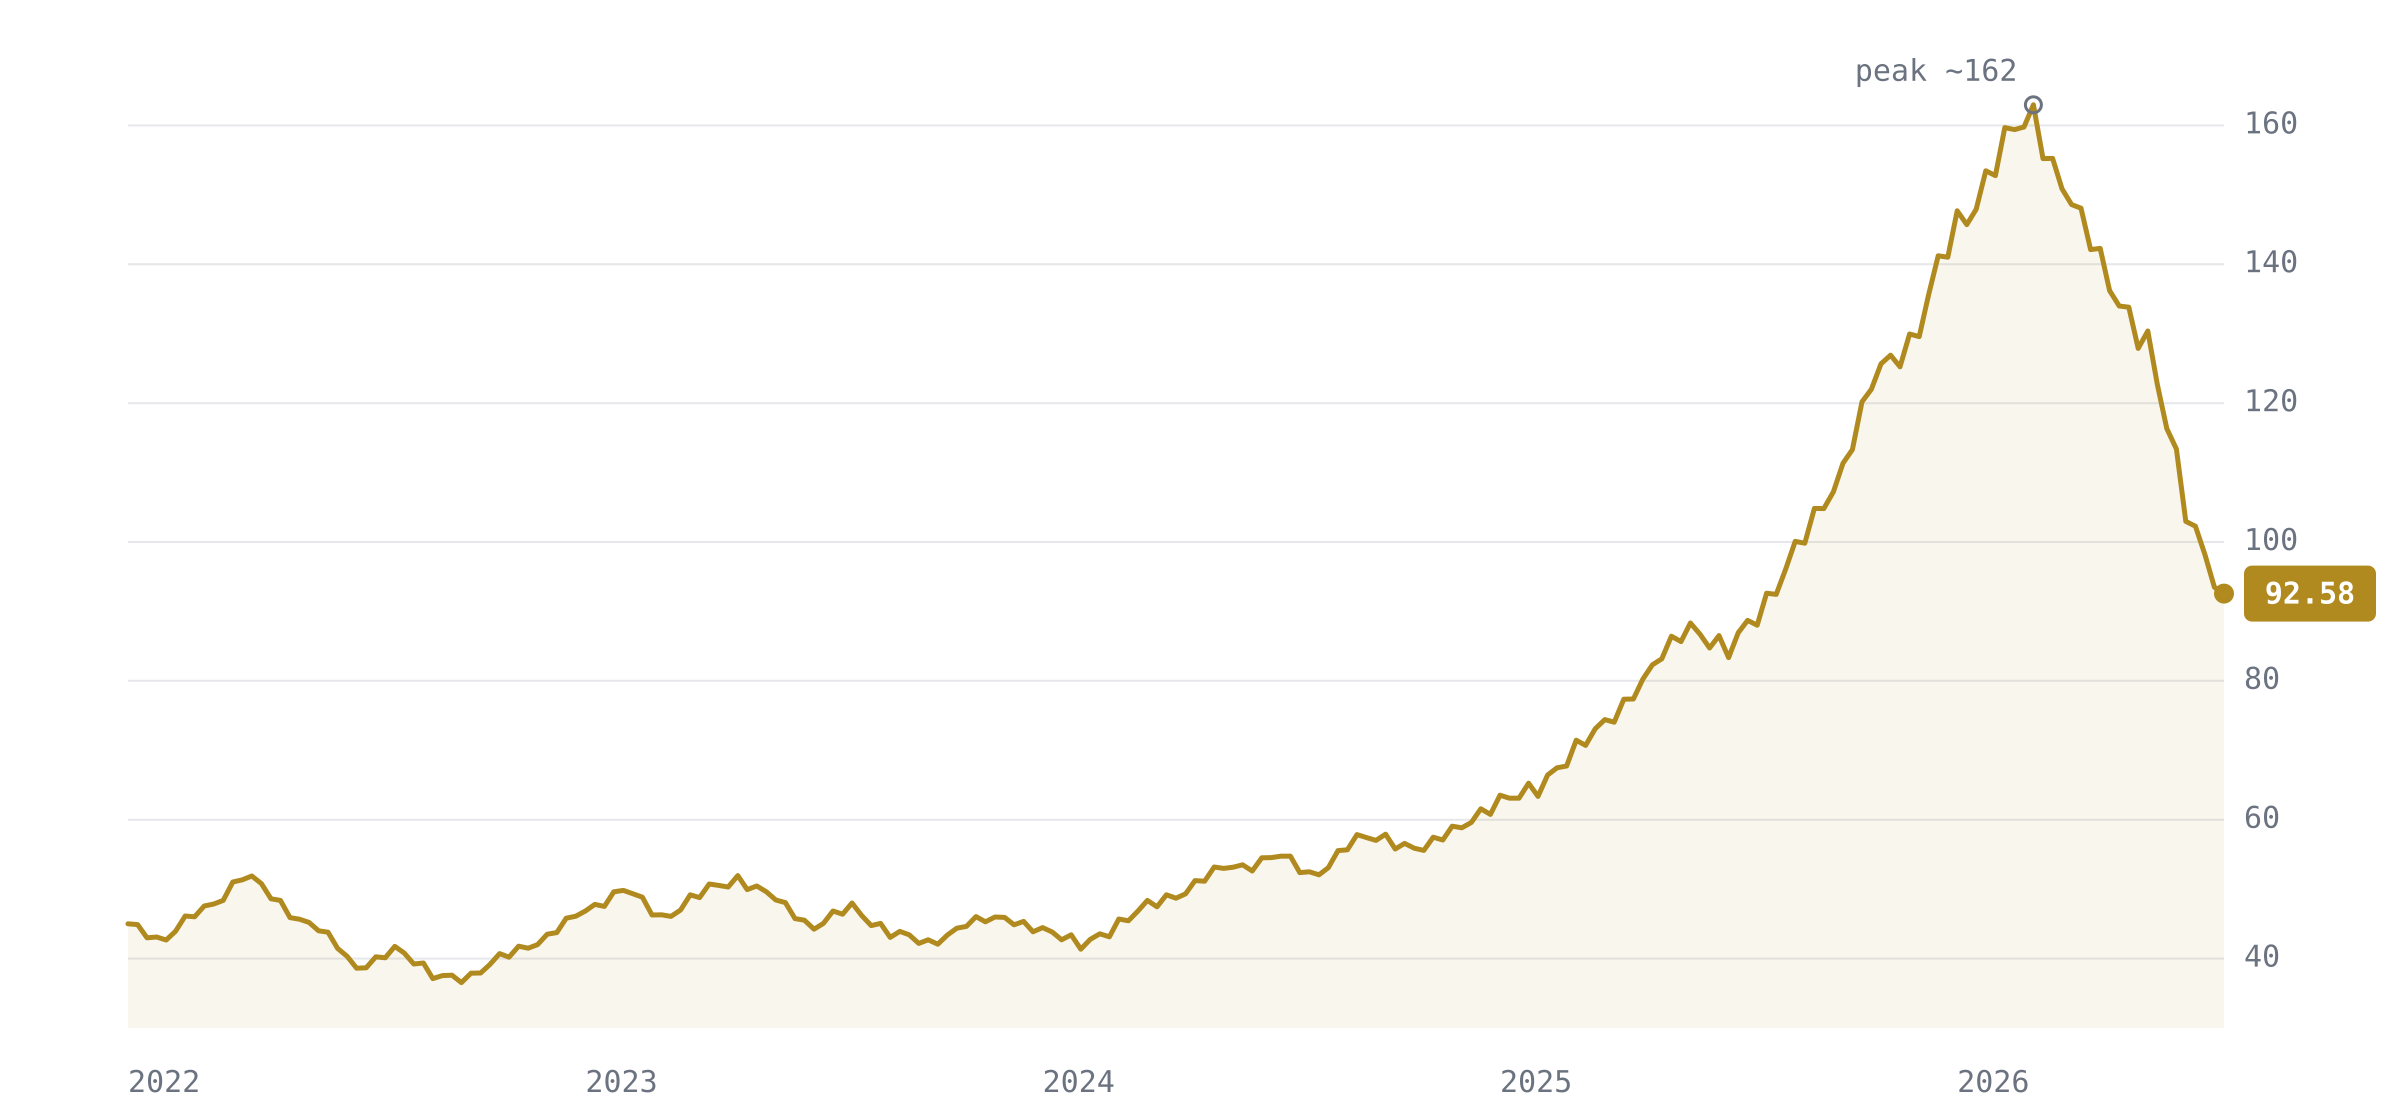
VanEck Gold Miners ETF (ASX: GDX)
Price, 2022 to August 2026. From a ~US$162 peak in early 2026 to 92.58 — a 43% drawdown while the sector's cash flows hit records.
Northern Star Resources (NST) has a significant production step-change underway. The KCGM mill expansion from 13 million tonnes per annum to 27 million represents the single biggest tonnage ramp-up on the ASX, commencing early next financial year. The company withheld FY27 guidance pending commissioning data, which means the market lacks clarity on timing. FY26 delivered 1.543 million ounces; the KCGM expansion has clear capacity to materially increase production.
Genesis Minerals (GMD) has agreed to merge with Vault Minerals — the binding Scheme Implementation Deed was signed on 14 July, with Vault shareholders due to vote in October–November. If approved, the deal is indicatively targeted to complete around November and creates a combined entity targeting 600–700,000 oz per year from consolidating the Leonora-Laverton district in Western Australia. Identified synergies are $2 billion over a decade. The merger represents mid-tier sector consolidation; deal risk exists but the stated synergies are material.
Ramelius Resources (RMS) delivered a 68% operating margin in the quarter — a company record. The company's AISC of A$1,973/oz on a current $4,050 spot price leaves a significant margin per ounce after mining and finance costs. The company is ramping Never Never (40% of this quarter's production), has $650m in cash, and is targeting 500,000 oz per year by 2030. Cost base and margin structure are relevant factors for assessing the company's leverage to gold-price movements.
Evolution Mining (EVN) and Greatland Resources (GGP) have fortress balance sheets. EVN closed FY26 with A$1.35 billion cash, net cash positive, and generated a record A$3.4 billion in operating cash flow (A$1.4 billion of free cash flow) at lower gold prices than January. Greatland holds A$1,289 million in cash and continues to build. Both companies have capacity to pursue acquisitions while other miners reduce capex — a relevant structural position if sector consolidation accelerates.
Perseus Mining (PRU) has announced material production growth initiatives. Yaouré underground and Nyanzaga are scheduled to come online in FY27, with indicative company guidance of 420–480,000 oz for that year (Perseus reports in US dollars and guides on a calendar-half basis). The company also reported positive reconciliation at Yaouré — the open pit delivered 24% more contained gold than the reserve model over the preceding six months. FY26 operating cash generation was approximately US$769 million, and the company ended June with about US$1.03 billion in cash and bullion.
Capricorn Metals (CMM) announced reserve growth and an expanded production outlook on 27 July, with FY26 production delivered within its guidance range. Bellevue Gold (BGL) posted record FY26 production of 143,539 oz, achieving the upper end of its production guidance. Both companies are executing within their stated planning parameters.
Jurisdictional risk context: Resolute Mining (RSG) experienced disruption in Q4 FY26 at Syama (Mali) due to geopolitical factors — security issues slowed equipment delivery and explosives shortages affected underground blasting. The company (a US-dollar reporter guiding on a calendar-year basis) is pointing to the lower end of its 195–210,000 oz production guidance range. Mali-based operations present a relevant operational risk profile distinct from the rest of the ASX gold cohort, most of which are either generating record cash flows or executing capital programs in more stable jurisdictions.
Companies & Angles Worth Watching
Production growth + structural central bank demandASX: NST
Northern Star (NST) offers pure production leverage. The KCGM mill ramp from 13Mtpa to 27Mtpa is concrete, and FY27 guidance is withheld pending commissioning data — the market may be discounting a near-term step-change.
Operating leverage to gold price recoveryASX: RMS
Ramelius (RMS) operates at a 68% operating margin and $1,973/oz AISC. The company's margin structure means material upside if gold prices recover toward the $4,500 consensus — making it a useful reference point for assessing gold-price sensitivity in the sector.
Consolidation dynamicsASX: GMDASX: EVNASX: GGP
Genesis (GMD) and the proposed Vault merger (shareholder vote October–November, indicatively completing around November) represent consolidation in the Leonora-Laverton district targeting 600–700,000 oz per year. Evolution (EVN) and Greatland (GGP) have the balance-sheet capacity to be acquirers if M&A accelerates. These dynamics are worth following as the sector adapts to price volatility against a structural demand floor.
Sector-level exposureASX: GDXASX: MNRS
The VanEck Gold Miners ETF (ASX: GDX) and Betashares Global Gold Miners Currency Hedged (ASX: MNRS) offer diversified exposure. GDX had a one-year total return of 42% to 30 June 2026; MNRS is up 96% over two years despite the July drawdown. Investors seeking sector-level exposure rather than individual stock picks might reference these benchmarks.
Market structure observation
Central banks accumulated a record 289 tonnes in Q2 while gold prices fell 16%. Concurrently, ASX miners reported record cash flows (Evolution: A$3.4bn operating / A$1.4bn free, Perseus: ~US$769m) at prices substantially below January peaks. The divergence between corporate cash generation at current spot prices and equity valuations reflecting January levels represents a notable market data point.
Data Sources
World Gold Council Gold Demand Trends Q2 2026 (published 30 July 2026); State Street Gold Monitor; Federal Reserve FOMC decision and OIS futures; WGC Central Bank Gold Reserves Survey 2026; ASX company announcements for Northern Star, Genesis, Vault, Ramelius, Evolution, Greatland, Perseus, Capricorn, Bellevue, Resolute (July 2026). ETF flow and holdings charts: Bloomberg, Company Filings, ICE Benchmark Administration, World Gold Council (data as of 24 July 2026).
A note on company and fund references
Companies and exchange-traded funds are named to illustrate exposure to the themes discussed and as reference points for how markets have priced these moves. They are not recommendations. Exchange-traded products carry their own risks, including tracking error, management fees and concentration.
General Advice Disclaimer
We provide only general financial product advice. You should note that general advice does not relate specifically to you and is prepared without taking into account any of your objectives, financial situation or needs. As a result, before acting on the general advice, you should consider the appropriateness of the advice, having regard to your objectives, financial situation and needs.
You should consider seeking the advice of relevant legal, taxation, superannuation, financial and/or other relevant advisors before the information is acted on. Where this report refers to securities, the general advice provided relates to securities which are listed on an exchange (usually the Australian Securities Exchange). This report also discusses commodities and commodity markets; any such commentary is likewise general in nature.
You should consider any information published by any listed company referred to in this report (including, without limitation, any prospectus, ASX announcements, or other investor updates published by the relevant company) before acquiring or investing in any shares.
Whilst Cashu Research has taken reasonable care, there is no guarantee by either Cashu Research, or its AFSL provider, ASG, that the information in this Research Report is accurate or up to date. Forward-looking statements, estimates, and projections are subject to risks and uncertainties that could cause actual results to differ materially. Cashu Research, its affiliates, directors, and employees may hold positions in securities or commodities discussed in this report.
The general advice in this Research Report is provided by Cashu Research. Cashu Research is part of Cashu Technology Pty Ltd, which is an authorised representative (AR # 001318029) of Adviser Solutions Group Pty Ltd (ABN 88 601 875 521) (AFSL 485946) (ASG).