
Cashu Ideas / Market note / 2 November 2026
Four stocks are a quarter of the ASX 200 and trade 35–55% above their own history. A full bank-led mean-reversion scenario takes the index close to 10% lower, including a modelled sympathy move in other financials, while non-financial stocks are held flat. This is a scenario, not a forecast. Here is where we think the money goes.
General financial product advice only. This note is not personal advice. Scenario analysis is illustrative only and is not a forecast. Read the full general advice warning.
Scenario calculations by Cashu Research. Index reference: 30 October 2026. Scenario outcomes are illustrative, assumption-dependent and are not forecasts.
The call
If the Big Four revert to their own long-run multiples, the full bank-led scenario takes about 860 points off the ASX 200, close to 10%. That figure includes a 15% sympathy move in Macquarie and other financials; it does not assume that the Big Four alone cause the entire decline. Non-financial stocks are held flat. This is not a crash call on Australia. It is arithmetic on four stocks that make up a quarter of the benchmark and trade 35–55% above their own history.
The de-rating risk sits in exactly the part of the index that has carried it, so the rest of the market does not have to follow. Small caps are already down 16% this year. Healthcare is at two-decade lows on relative P/E. Resources answer to gold above US$4,000/oz and copper, not CBA's multiple. In a bank-led drawdown we expect quality small caps, select miners, healthcare and tech to hold or outperform.
Assumptions at a glance
The 9.6% / 860-point figure is the full bank-led scenario: Big Four mean reversion plus a 15% sympathy decline in Macquarie and other financials. Non-financial stocks are held flat; earnings are held flat. It is an illustrative model, not a forecast.
A bank ETF with a mining sleeve
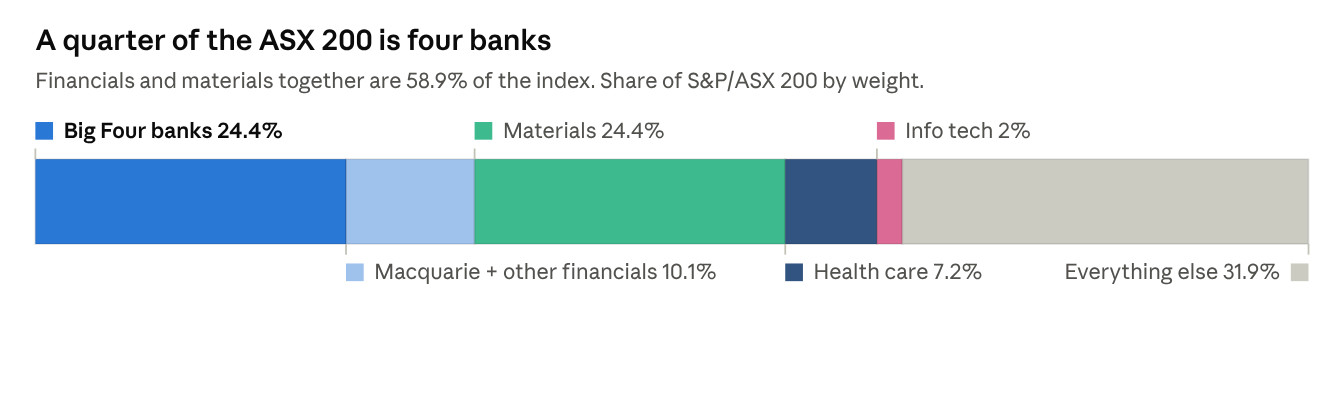
iShares Core S&P/ASX 200 ETF (IOZ) holdings, 29 Oct 2026 · sector weights
CBA alone is 10.3% of the index, more than every listed tech and healthcare company outside CSL put together. The ten largest names are half the benchmark. When the banks rally, the index prints a record while the median stock goes nowhere; that was 2026. The reverse is also true: a bank de-rating would read as a market crash on the front page while most of the market was untouched. Weights.
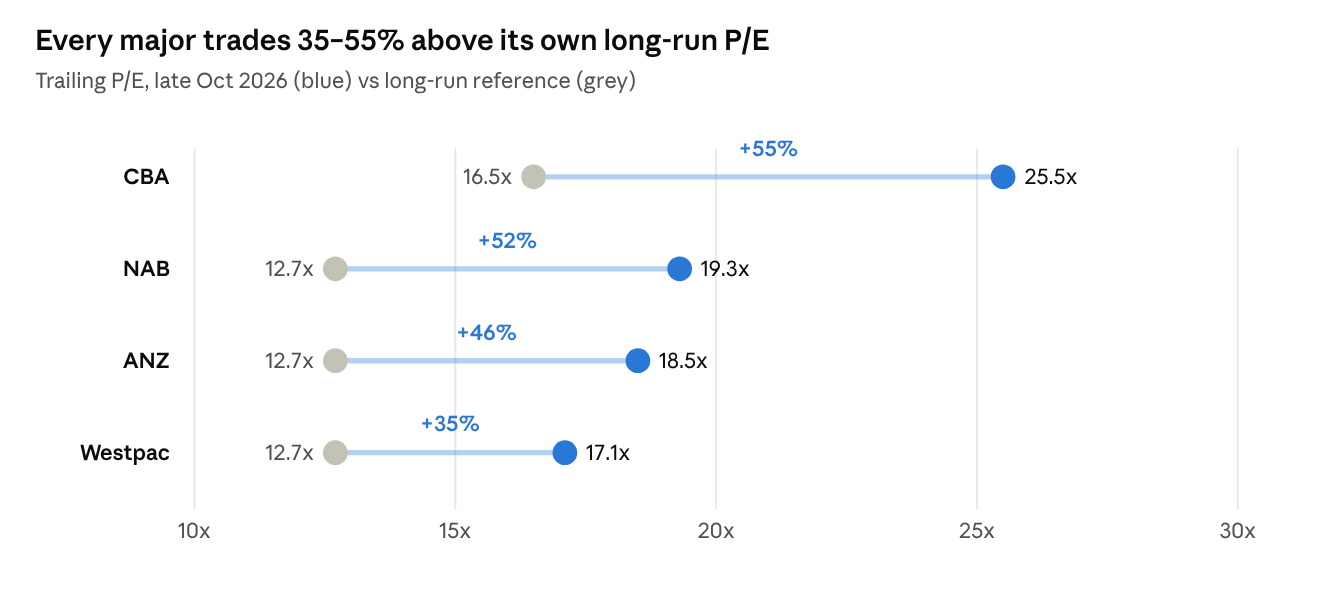
Paying a growth multiple for no growth
CBA: The Bull, 30 Oct 2026; NAB/WBC: The Bull, Oct 2026; ANZ approx.; CBA 10-yr median via GuruFocus/Lonsec; sector 20-yr average via Wilsons Advisory
The premium is not being paid for earnings. CBA's FY26 cash profit grew 7%; the other three have delivered flat-to-low-single-digit growth for years and the majors' combined earnings only recently got back to 2018 levels. Sector ROE is about 11%, below its own long-run 12%. UBS has the sector's P/E relative to the ASX 200 more than two standard deviations above its historical average. What the market is paying for is yield, franking and super flows with nowhere else to go.
And the backdrop is turning. A fifth RBA hike is now the base case for November. Home-loan applications are down 12–20% across the majors, Westpac has confirmed lending volumes have fallen sharply, and the mortgage price war is compressing margins. Consensus already has CBA at a sell with targets around A$125–128, roughly 24% below the price. We are not more bearish than the street; we are just applying the street's view to the index. Sources: The Bull, Market Index, Wilsons, Motley Fool.
What mean reversion does to the index
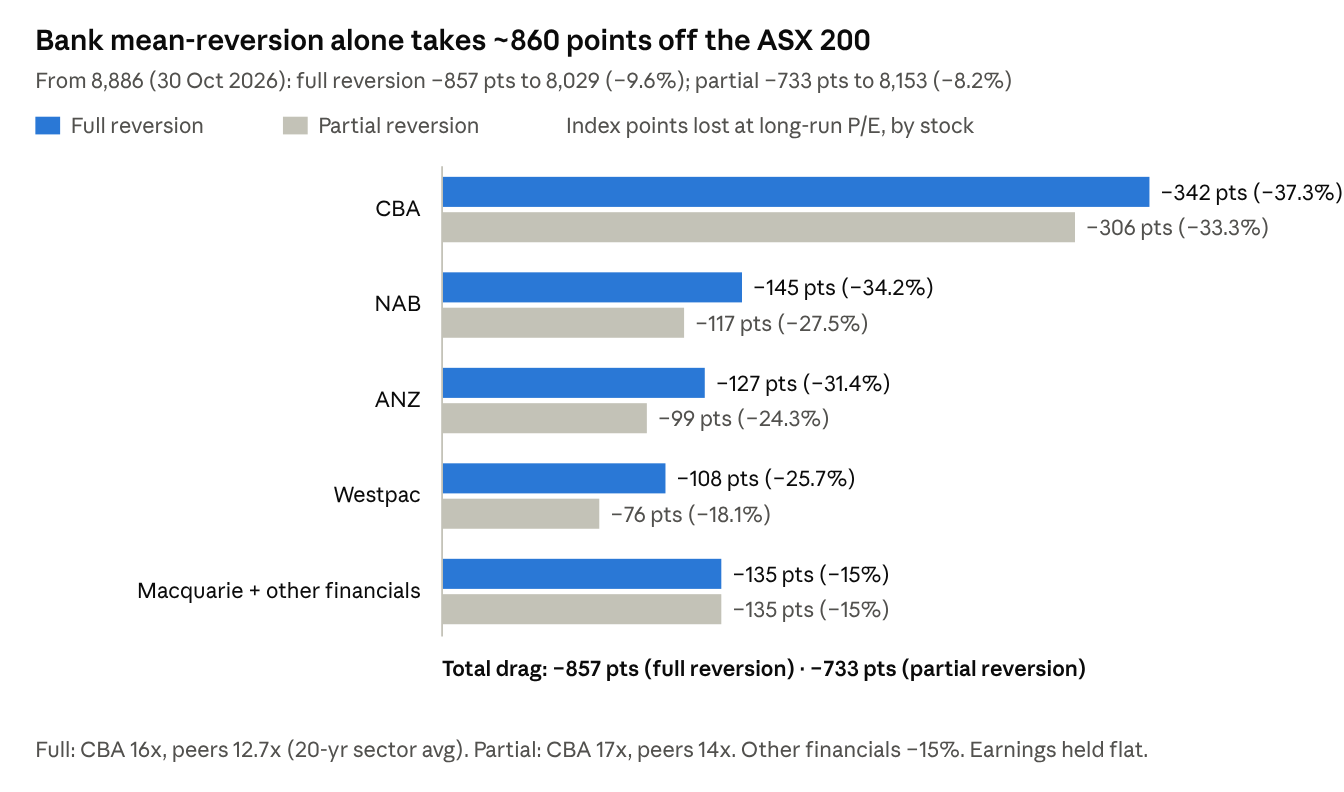
Two cases, earnings held flat, so the fall is the multiple alone. Full: CBA to 16x, the others to the sector's 20-year average of 12.7x. Partial: CBA 17x, the others 14x, about where the sector has settled after past de-ratings. Each bank's fall times its index weight gives the points off the ASX 200, plus a 15% sympathy move in Macquarie and the rest of financials, because a bank de-rating has never stayed inside the Big Four.
Cashu Research calculation · index weights from IOZ holdings 29 Oct 2026, multiples late Oct 2026, ASX 200 at 8,886 on 30 Oct 2026
“CBA is the largest single contributor to the modelled index downside.”
Full case: ASX 200 at about 8,030, down 9.6%. Partial: about 8,150, down 8.2%. CBA is the largest single contributor to the modelled index downside; a move to its consensus target alone is roughly 250 points. No earnings shock, credit event or housing crash is required. If bad debts normalise from record lows, the earnings leg moves too and the downside compounds. We have deliberately not modelled that.
| Case | Big Four assumption | Other financials | ASX 200 outcome | Points / change |
|---|---|---|---|---|
| Full reversion | CBA 16x; peers 12.7x | −15% | 8,029 | −857 / −9.6% |
| Partial reversion | CBA 17x; peers 14x | −15% | 8,153 | −733 / −8.2% |
Why the rest of the market doesn't have to follow
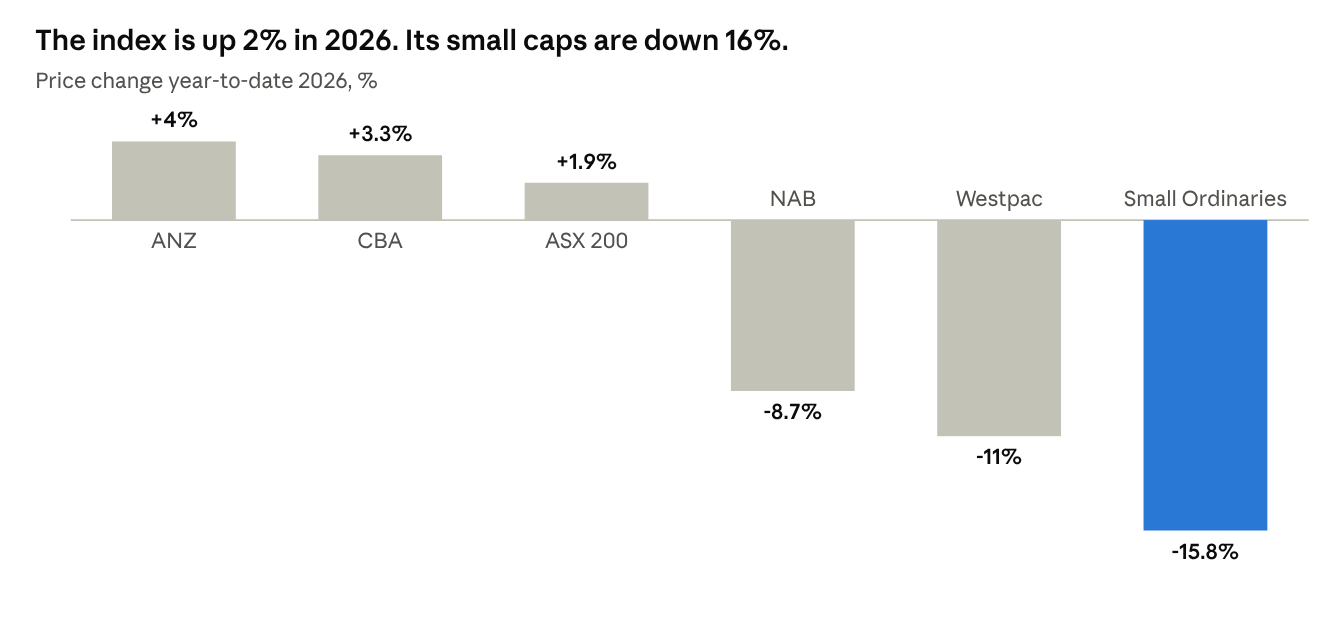
S&P Dow Jones Indices (Small Ords, 29 Oct 2026); The Bull (CBA 29 Oct, NAB/WBC 7 Oct); Motley Fool (ANZ, 22 Sep) · dates differ by name
A bank de-rating is a repricing of one crowded trade, not a recession. The banks are expensive because of flows (super, passive ASX 200 money, franking-driven retail), not fundamentals. When that unwinds, the money has to go somewhere, and the obvious destinations are the parts of the market those flows have starved.
Small caps have already had their bear market. The Small Ordinaries is down 15.8% in 2026 to its lowest level since May 2025 while the ASX 200 is up 1.9%, an 18-point gap driven almost entirely by heavyweight bank support (S&P DJI). Financials are 11% of the Small Ords and the Big Four none of it. Eighteen months of de-rating is already in the price.
Resources answer to commodity prices, not CBA's multiple. Gold above US$4,000/oz has the mid-tier producers growing earnings while bank earnings stall. Copper and critical minerals have their own cycle tied to grid build-out, data-centre power and Western supply policy, none of which moves when Australian mortgage margins compress. We would be selective: gold producers with growing output, funded copper developers, critical-minerals names with offtake. Iron ore majors are a China call, not a rotation call.
Healthcare and tech are the mirror image of the banks: good businesses on bad multiples. Wilsons has ASX 100 healthcare at two-decade lows on relative P/E, with CSL on roughly 14–16x forward, below global peers for the first time in over a decade (Wilsons via Motley Fool). Tech is under 2% of the index and is where the only double-digit earnings growth on the ASX lives. A rotation out of the banks does not need new money; it needs existing money to go where the growth is.
These sectors can still fall in a risk-off tape. But a bank mean-reversion is not a risk-off tape. When the ASX 200 reads minus 8% on a bank de-rating, a portfolio built around quality small caps, select resources, healthcare and tech should read closer to flat, and in a rotation could be up.
How we'd play it
The next three weeks are the test. Westpac, NAB and ANZ report in early November, the RBA meets with a hike as base case, and CBA's Q1 update lands mid-month. Watch for margin guidance going backwards, negative home-lending growth, arrears off record lows and bigger provisions. We do not need to be right on timing for the valuation argument to hold.
Underweight the Big Four; CBA the preferred short, ANZ the least bad hold. On the other side, a basket, not a single name: gold and copper producers with growing output, ASX 100 healthcare below its own ten-year average multiple, profitable tech with double-digit growth, and quality small caps sold with the index rather than on their own numbers. That last bucket is where Cashu Research's coverage sits, and this note is the macro frame for it.
“The trade is not ‘sell Australia’. It is ‘stop holding the ASX 200 as if it were a diversified index’.”
What breaks this view
Expensive can stay expensive. The premium has survived two years of sell ratings; super and passive flows are structural. Mean reversion is a direction, not a date. A hike widens margins before it lifts arrears, so a 5–10% FY27 earnings upgrade would absorb part of the compression; we held earnings flat. If the trigger is global risk-off rather than a bank-specific repricing, small caps, resources and tech fall with the banks and usually harder. Our long-run multiples are broker and data-provider estimates, not an official series; the direction is robust, the decimals are not. Small caps have been cheap for a while and can get cheaper; the exit is narrower than the entrance.
Sources and disclosures
Sources. Index weights: iShares Core S&P/ASX 200 ETF holdings as at 29 Oct 2026, via WhichIndex. CBA price, multiple, FY26 result, consensus targets and RBA expectations: The Bull, 30 Oct 2026. NAB and Westpac multiples and year-to-date performance: The Bull, Oct 2026. Bank sector 20-year average P/E: Wilsons Advisory. CBA 10-year median P/E: GuruFocus. UBS valuation and ROE commentary: Market Index, Aug 2026. Goldman Sachs 35-year-high commentary: Maple-Brown Abbott. Home-loan application declines and bank index share: The Motley Fool, Sep 2026. Small Ordinaries performance and sector weights: S&P Dow Jones Indices. Weekly index levels: Small Caps weekly wrap, 16 Oct 2026 and Market Index evening wrap, 27 Oct 2026. Healthcare valuations: Wilsons via The Motley Fool, Mar 2026. Scenario calculations are Cashu Research's own. Prepared by Fox Slotemaker, Research Manager, Cashu Research.
General advice warning.This report has been prepared by Cashu Research, a division of Cashu Technologies Pty Ltd, Corporate Authorised Representative (AR No. 001318029) of Adviser Solutions Group Pty Ltd (AFSL 485946). It contains general information and general financial product advice only. It has been prepared without taking into account the objectives, financial situation or needs of any particular person. Before acting on any information in this report, you should consider its appropriateness to your own circumstances and seek independent professional advice. Past performance is not a reliable indicator of future performance. Scenario analysis is illustrative only, relies on assumptions that may not hold, and is not a forecast. Valuation multiples and index levels are as at the dates cited and will have changed. Cashu Research, its directors, employees and associates may hold positions in, or provide services to, securities and sectors discussed in this report.
Header photograph: Pexels. Illustrative Sydney skyline; not a bank office or premises.