Market note · 19 November 2026. Prices and moves refer to the 18 November US and London sessions. Hero image: AI-generated editorial illustration.
Gold broke below US$3,800, silver fell 5% and copper had its worst day in eight months on Wednesday, 18 November. The trigger was one idea that markets have now fully swallowed: the Federal Reserve is going to raise rates in December, not cut them. Add a dollar near a 19-month high, a 10-year Treasury yield above 5%, and an AI trade that is unwinding hard, and you get a session where almost nothing in the commodity complex was spared.
The short version. This was a macro sell-off first and a fundamentals story second. Gold and silver were hit by real rates and the dollar. Copper was hit by those same forces plus crowded speculative positioning built on the AI data-centre story, which is now being taken apart. Oil, platinum, tin and the base metals got caught in the same undertow.
Why it matters for ASX investors. Resources are the engine room of the Australian market, and the ASX's gold and copper names had been the market's favourite trade for most of 2026. The question now is whether this is a washout or the start of something longer. Our view is at the end.
The scoreboard
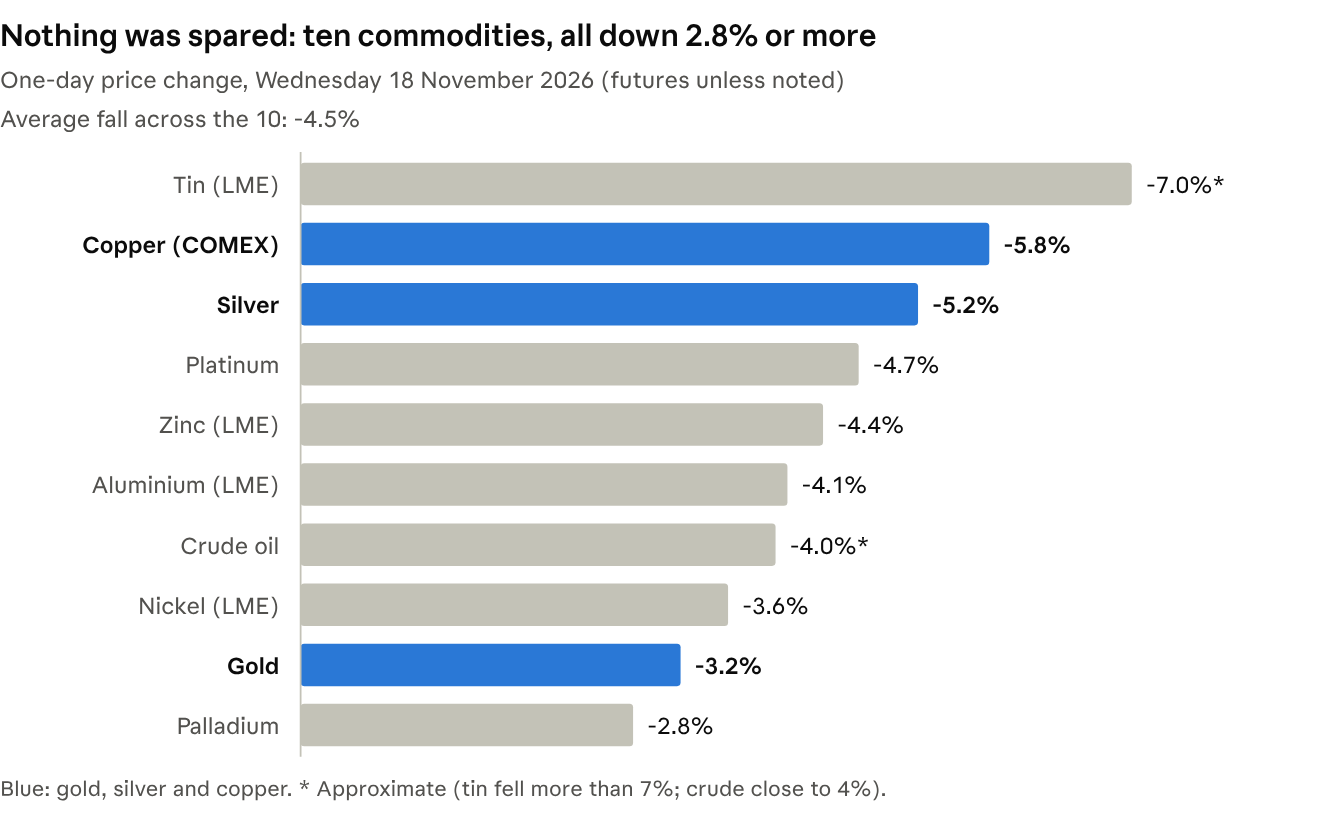
The breadth is the story. When gold, copper, oil and zinc all fall together, the cause is not in any one market's supply and demand. It is the dollar and the cost of money. In dollar terms, the gold and silver sell-off alone erased more than US$500 billion in value in a day.
Driver one: the Fed is hiking, and the market finally believes it
Two weeks ago a December hike was a maybe. Now it is a lock. On 5 November, futures put the odds of a December Fed hike at 67%. Then the October jobs report showed 165,000 new jobs, roughly 2.5 times what economists expected. CPI came in hot on 10 November, and Governor Christopher Waller said the Fed should hike. By Wednesday, CME FedWatch had a 25 basis point move at about 95%, with the remainder on a 50 point move (Yahoo Finance, 24/7 Wall St.).
Wednesday poured petrol on it. Waller went further in a live interview and floated a half-point hike to "shock people", pushing the 2-year yield up to 4.83% (Pomegra). Minutes from the October meeting, released the same day, showed a couple of policymakers open to more than 25 points if inflation data stays unfavourable (Investing.com). For context, the Fed already hiked in September, its first increase in over three years, and sits at 3.75%–4.00%.
Why that crushes gold. Gold pays no yield. When a risk-free US Treasury pays over 5% for ten years, the opportunity cost of holding bullion is at its highest in nearly two decades. Since 5 November the US dollar index is up 2.2% and the 10-year yield has climbed from 4.84% to 5.10%, while gold has fallen about 8% over the same window. A stronger dollar also makes metals more expensive for everyone buying in other currencies, which trims physical demand from Asia and Europe.
Driver two: copper's AI premium is being taken back
Copper was also hit hard, with reported daily moves varying by source and capture time. COMEX copper dropped 4.9% to US$5.695/lb, its steepest one-day fall in eight months and a fifth straight losing session. It is now 14% lower in three weeks and 17% below its 9 September record of US$6.8885/lb. On the LME, three-month copper touched US$12,640/t, the lowest since April, against a record of US$14,875/t (Discovery Alert, Business Recorder).
The AI trade was the spark. Copper had become a proxy for the data-centre build-out. Goldman Sachs tied the slide to the sell-off in AI equities since the Democratic midterm win, with sentiment worsening after Nvidia CEO Jensen Huang resigned on 12 November (MINING.COM). Tin, the other metal most tied to AI, fell more than 7%. Bloomberg reported that copper and tin, the two metals most exposed to AI, posted the steepest falls (The Edge Singapore).
Positioning turned a correction into a rout. Speculators had piled in. CME net long positions hit 82,649 contracts in mid-September, the most since 2021, and had already been cut to 34,444 by early November. Wednesday's move had the hallmarks of the rest of that book being flushed. One analyst summed it up neatly: AI was the trigger, but not the driver (Mining.com.au).
Then came the big names. Stanley Druckenmiller, one of copper's loudest bulls, disclosed in a filing that he now holds short copper positions. Bespoke attributed part of Wednesday's 5%+ fall to that disclosure (Bespoke). Natixis has called the mix of US stockpiling and AI flows a bubble, and Mercuria's Nicholas Snowdon said current demand looks more like a recession than growth.
China and tariffs added weight. China's October data missed on consumption and industrial output, and investment unexpectedly declined. Hopes of US tariffs on refined copper have also faded since the midterms, erasing the US price premium that had pulled metal into COMEX warehouses.
But the physical market is not collapsing. The Yangshan import premium hit a record US$360/t, up from under US$100/t in September, and Chinese warehouse stocks are at their lowest since December 2023. Chile's Cochilco expects 2026 output down 8.4%. Physical buyers in China are stepping in at these prices, which is the clearest sign this is a paper sell-off rather than a demand collapse.
Silver and platinum: the high-beta casualties
Silver is now more than 60% below its January record. It fell to about US$45 on Wednesday, a new 2026 low, against a peak of US$121.67 in January. That puts it back below its 1980 and 2011 highs near US$50 (BeInCrypto, Bitcoin.com News). Gold, by comparison, is about 33% off its January high of US$5,608.
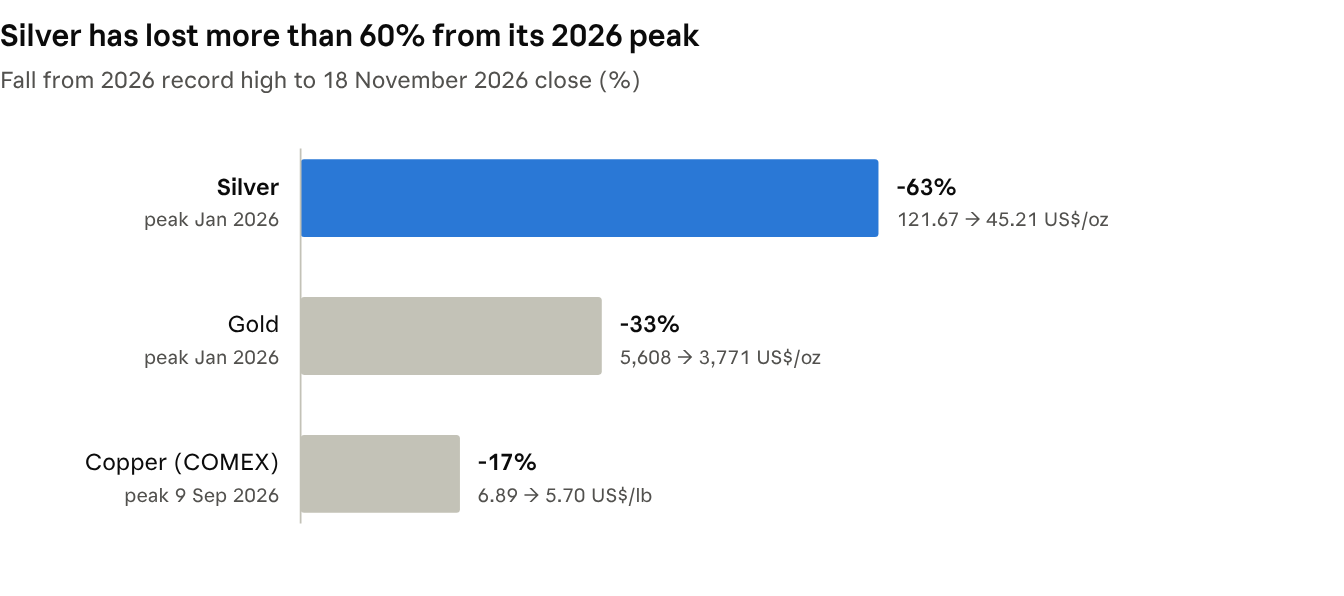
Silver gets hit twice. It trades with gold as a monetary metal, so it takes the rates and dollar hit. But more than half its demand is industrial, so it also takes the growth and AI hit that is sinking copper. Fading solar demand has been a drag all year. That double exposure is why silver typically falls 1.5 to 2 times as far as gold in a sell-off, and why the gold-to-silver ratio has blown out to around 82.
Platinum and palladium followed. Platinum futures fell 4.7% and palladium 2.8% on the day (Investing.com). These are thin markets, and when leveraged money exits the precious metals complex at once, the smaller metals gap the hardest.
What it means for ASX resources
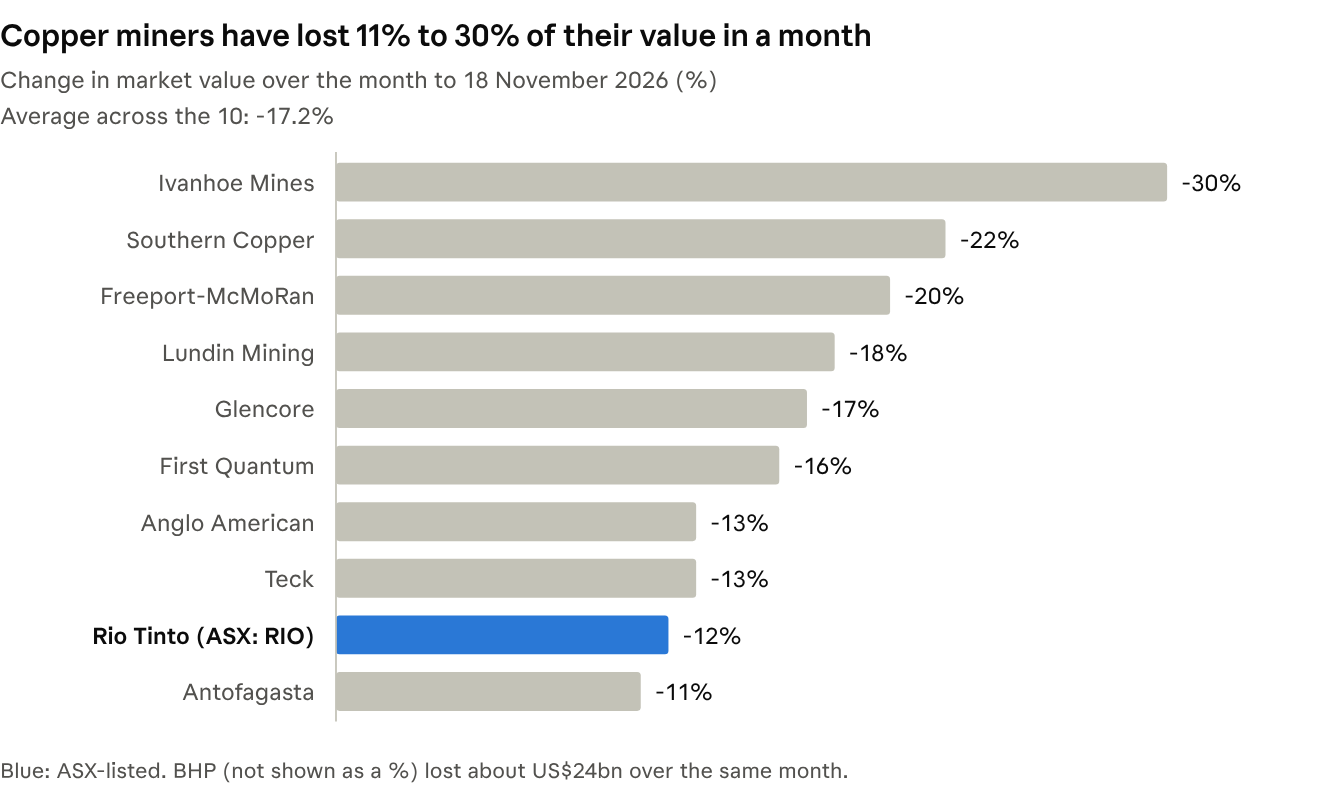
The ASX felt it before Wall Street did. On Wednesday the All Ords Gold index flipped from a 1.7% gain to a 2.2% loss as gold slid through the Asian session, a near 4% intraday swing, and the ASX fell for a fifth straight day (Market Index). Northern Star closed at A$24.18, down 1.67% (Kalkine). Offshore, the overnight damage was worse: in London Anglo American fell 7.2% and Rio Tinto 4.7% (Investing.com), while in New York Freeport-McMoRan dropped 7.4% and Southern Copper 6.9% (Proactive). Expect that to flow into today's open in Sydney.
The big end has already lost a lot. Eleven major copper producers have shed a combined US$141 billion in market value over the past month, US$68 billion of it in the last week. BHP is about US$24 billion lighter.
Gold miners are operationally leveraged, both ways. Their costs are largely fixed, so a move in the gold price produces a much bigger move in their margins. Northern Star reported an all-in sustaining cost of A$3,217/oz for the September quarter. At today's prices the Australian-dollar gold price still sits well above that, so producers remain very profitable. What has changed is the slope: the upgrades are over for now.
Juniors and explorers are the most exposed. Small-cap gold and copper developers trade on sentiment and access to capital. When the commodity turns, their share prices usually fall further than the producers, and capital raisings get harder and more dilutive. Companies that raised money in the first half of 2026 are in a far better spot than those that need to come back to market before Christmas.
The Cashu Research view
This is a rates shock, not a broken thesis. Nothing about Wednesday changed mine supply, Chinese physical buying or central bank appetite for gold. What changed is the price of money. Commodities priced for rate cuts in early 2026 are being repriced for hikes, and leveraged traders are being forced out. That process tends to overshoot.
Copper is where we would look first, carefully. A record Chinese import premium, falling Chinese inventories and shrinking Chilean output do not describe a market in surplus. The AI premium is gone and the speculative long has been mostly flushed. That is usually closer to the end of a sell-off than the start. We would want to see the LME hold the US$12,500–12,700/t zone before getting constructive.
Gold needs the Fed to blink. As long as the 10-year yield holds above 5% and the market keeps adding hikes, gold has no catalyst. The turn will likely come from a soft data print or a Fed that sounds less certain after December. Until then, the quality producers with low costs and clean balance sheets are the place to be, not the explorers.
Silver is the most stretched. Down more than 60% from its peak and below its 1980 high, silver is the coiled spring of this complex. It will also keep falling hardest if the macro gets worse.
What to watch:
- 9 December FOMC decision. 25 or 50 basis points, and above all the tone of the guidance for 2027.
- US 10-year yield. A move back below 5% would be the first relief signal for gold.
- US dollar index. Currently near a 19-month high; a reversal helps every dollar-priced metal.
- LME copper at US$12,500–12,700/t. Holds, and the bottom is likely in. Breaks, and US$12,000 comes into view.
- US refined copper tariff decision. Firm rejection weighs on COMEX; renewed talk revives the US premium.
- AI capex headlines. Copper and tin will keep trading off the mood in AI stocks in the short term.
Prices and moves are as reported on 18 November 2026 (US and London sessions) and may differ slightly between sources depending on the time captured.
Disclaimer: This market note is issued by Cashu Technologies Pty Ltd (Cashu Research), a Corporate Authorised Representative (AR No. 001318029) of Adviser Solutions Group Pty Ltd (AFSL 485946). It contains general information only and does not take into account your objectives, financial situation or needs. It is not a recommendation to buy or sell any security or commodity. Past performance is not a reliable indicator of future performance. Consider seeking independent financial advice before making any investment decision.